Select a title below to collapse or expand its information panel.
2026 update to Map Sheet 52 - Aggregate Sustainability in California
April 27, 2026
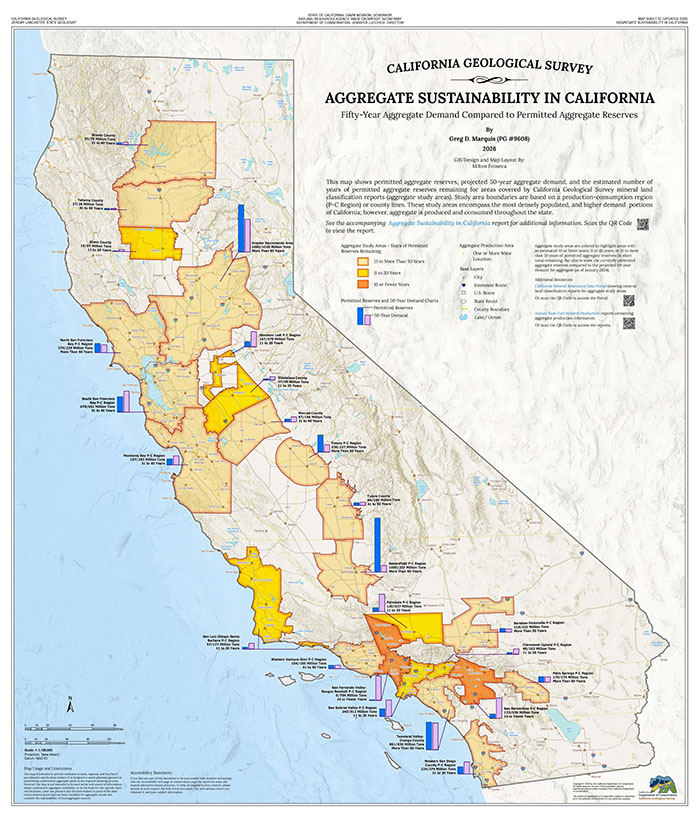 Map Sheet 52: Aggregate Sustainability in California showing fifty-year aggregate demand compared to permitted aggregate reserves.
by Greg D. Marquis, PG
Aggregate is essential to maintaining existing infrastructure and supporting new construction, making it a resource of critical economic importance. Because aggregate is a low unit-value, high-bulk-weight commodity, it must be sourced close to where it is used to reduce transportation-related economic and environmental costs. When nearby sources are unavailable transportation costs can quickly exceed the value of the material and result in increased construction costs, fuel consumption, greenhouse gas emissions, air pollution, traffic congestion, and road maintenance.
Map Sheet 52 is a statewide overview of projected future aggregate needs and currently permitted reserves. The map shows the projected years of permitted reserves remaining, and highlights regions where fewer than ten years of permitted aggregate supply remain. The current estimates of permitted aggregate reserves, aggregate demand, and years of permitted reserves remaining are based on conditions as of January 1, 2024.
To download this release, visit the Aggregate Sustainability in California web page.
CALIFORNIA GEOLOGY™ Magazine volume 56
January 2026
The California Geological Survey is pleased to announce its latest issue of CALIFORNIA GEOLOGY magazine. This issue contains articles about debris flow prediction modeling, lithium potential in California, mapping the subsurface in 3D for geologic carbon sequestration, and more.
To download this release, visit the CALIFORNIA GEOLOGY web page.
Previous Announcements
Select a title below to collapse or expand its information panel.
Maps for New and Revised Earthquake Fault Zones in Three Counties
November 20, 2025
Index map showing outlines of the Earthquake Fault Zone maps in this release. Click an image to open a larger version in a new window.
The California Geological Survey released official maps and reports for Alquist-Priolo Earthquake Fault Zones affecting the city of Half Moon Bay and the counties of San Mateo and Santa Cruz, and the cities of Arcadia, Glendale, La Canada Flintridge, Monrovia, Pasadena, and Sierra Madre, and the county of Los Angeles.
Earthquake Fault Zones are regulatory zones that encompass surface traces of active faults that have a potential for future surface fault rupture. These maps are released under the authority of the Alquist-Priolo Earthquake Fault Zoning Act (Alquist-Priolo Act) that was passed following the 1971 San Fernando earthquake. The Alquist-Priolo Act is a state law designed to reduce the hazard from surface fault rupture during an earthquake.
In This Release
- Fault Evaluation Report 263: The Sierra Madre Fault Zone in the Pasadena and Mt. Wilson 7.5-Minute Quadrangles, Los Angeles County, California
- Fault Evaluation Report 275: The San Gregorio Fault Zone in the Montara Mountain, Half Moon Bay, San Gregorio, La Honda, Pigeon Point, Franklin Point, and Point Ano Nuevo 7.5-Minute Quadrangles, San Mateo and Santa Cruz Counties, California
- Seven (7) Earthquake Zones of Required Investigation Maps (EZRIM).
Downloadable PDFs and Spatial Data
The maps, reports, and GIS shapefiles related to this release can be downloaded any time from our Information Warehouse Regulatory Maps Portal. If you wish to look up a specific parcel or address, we recommend our California Earthquake Hazards Zone application ('EQ Zapp').
Related Reference Material
- Reference Guide for Assessing Fault Rupture Hazards (Special Publication 42: Earthquake Fault Zones - A Guide for Government Agencies, Property Owners/Developers, and Geoscience Practitioners for Assessing Fault Rupture Hazards in California). This document contains technical guidelines for evaluating surface fault rupture hazards and for reviewing geologic reports.
Maps for New Seismic Hazard Zones in Five Counties
November 20, 2025
 Index maps showing outlines of the Seismic Hazard Zone maps in this release. Click an image to open a larger version in a new window.
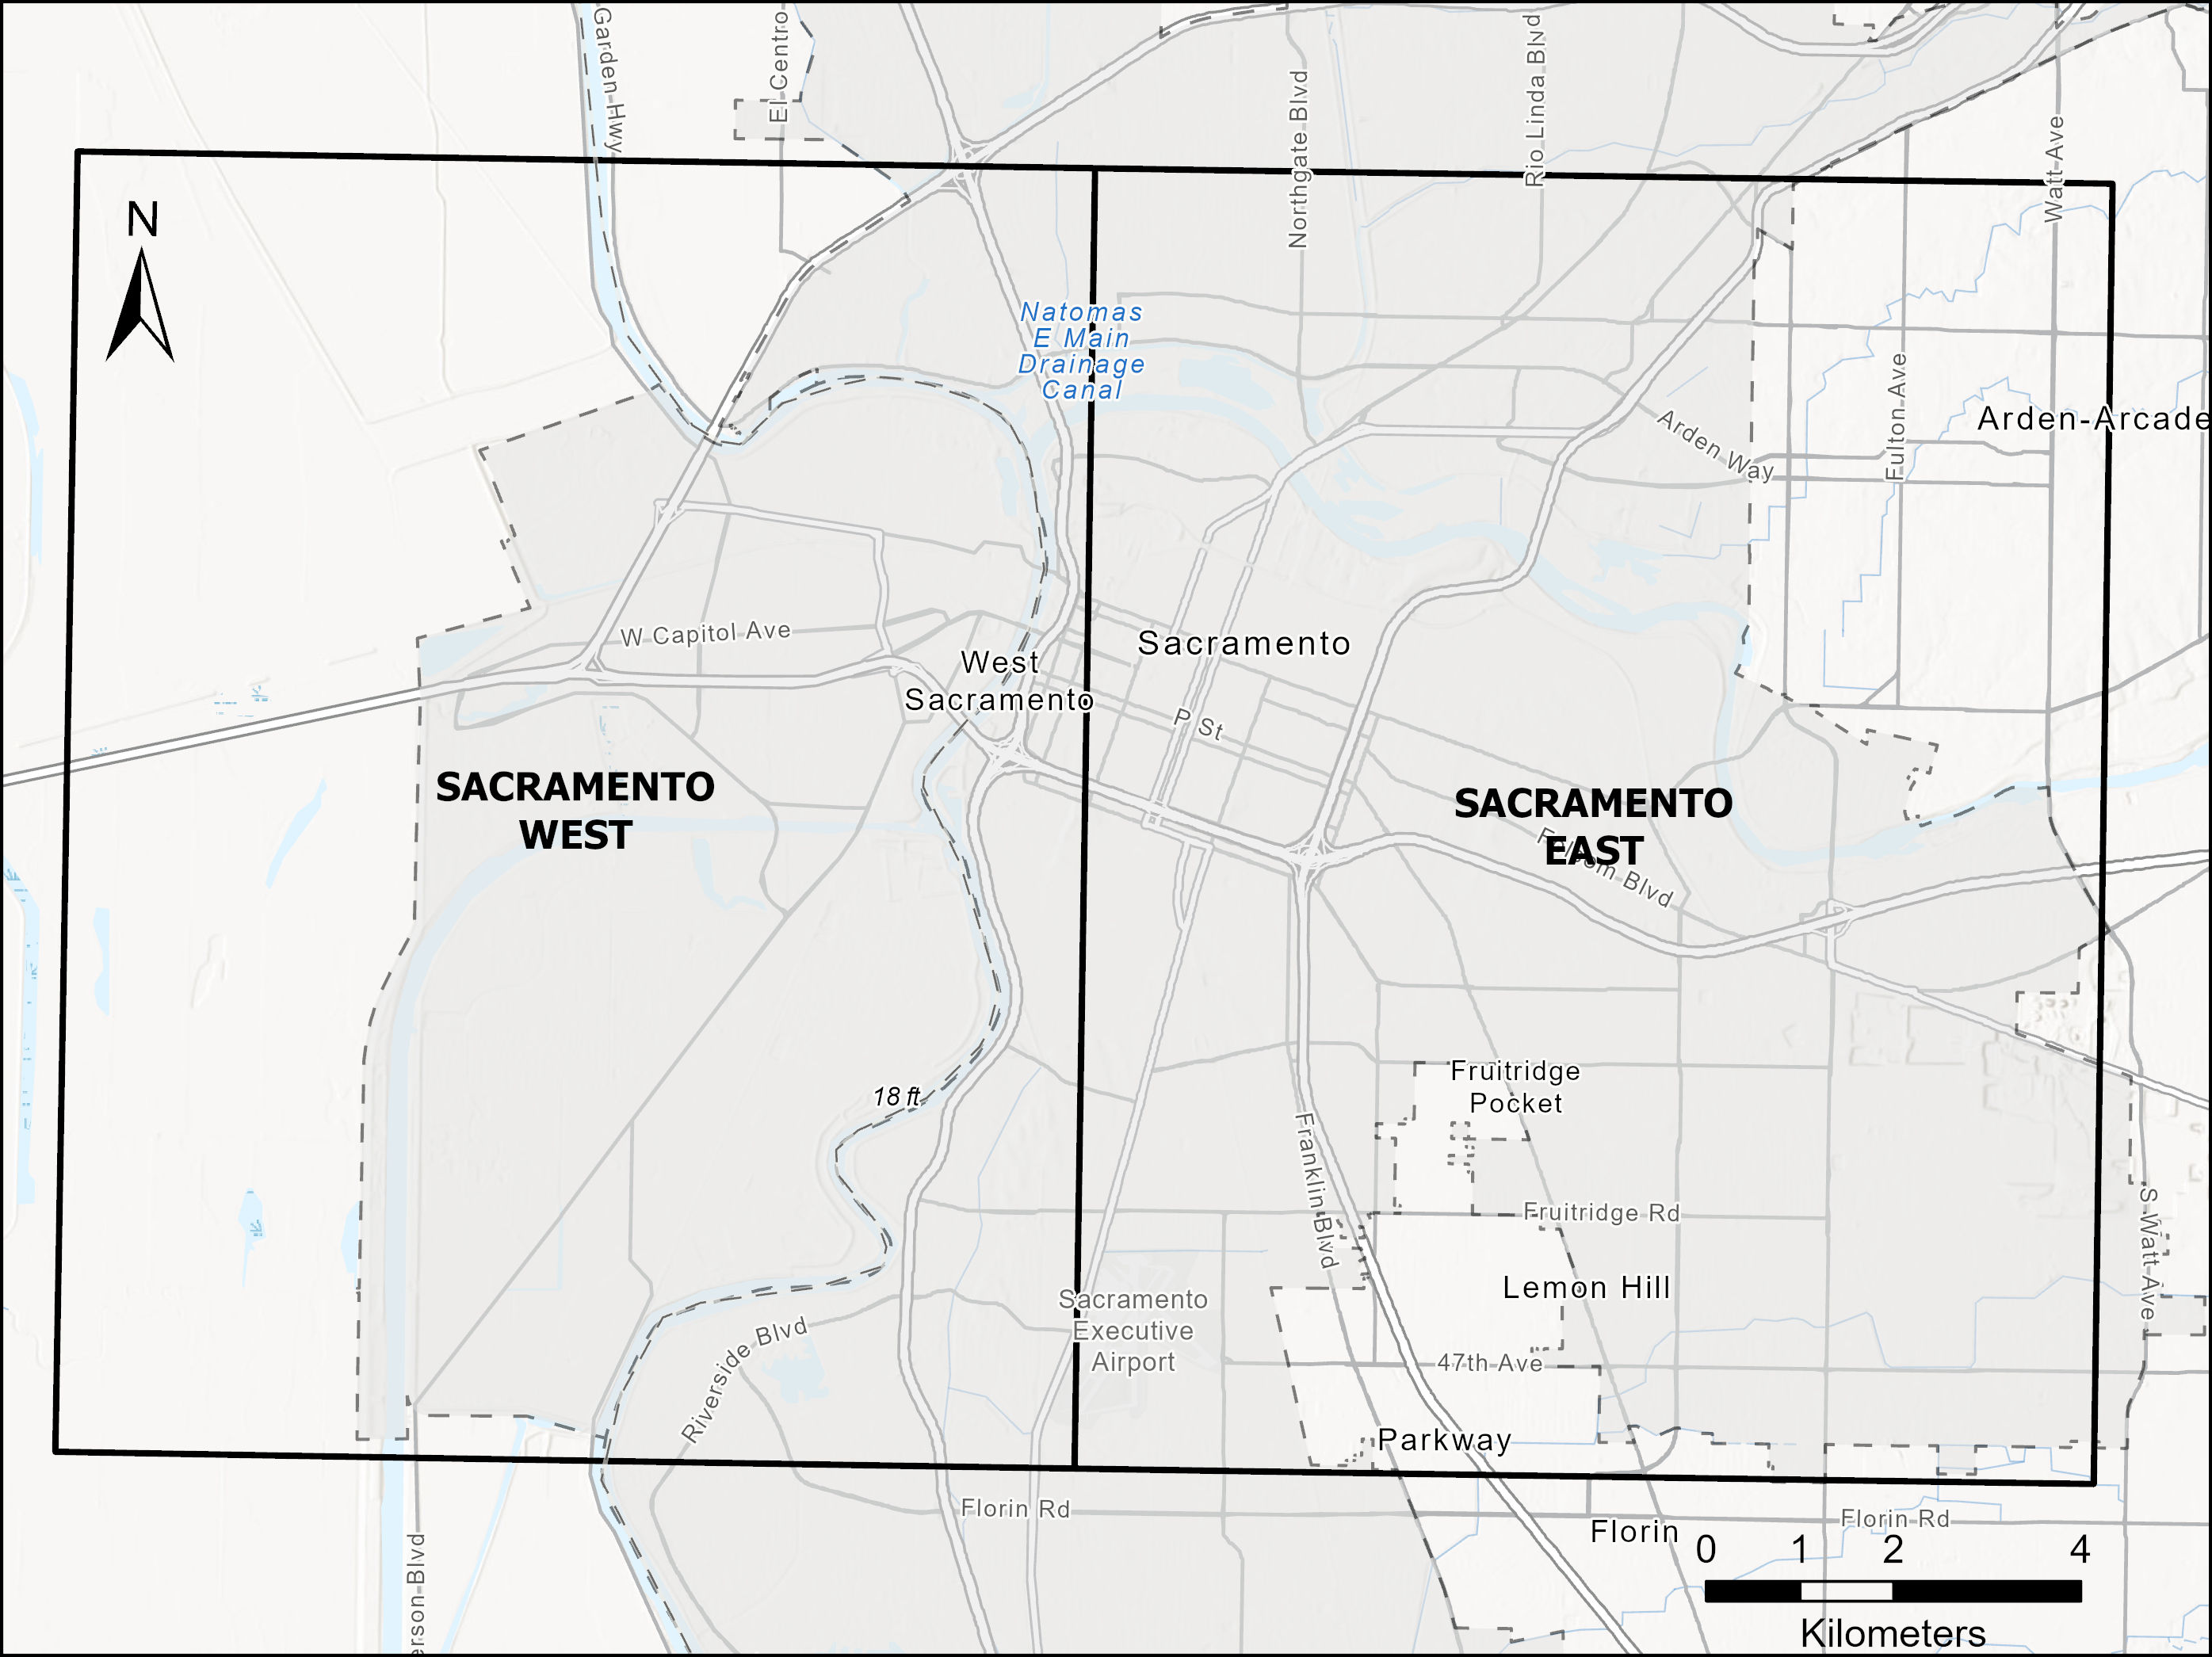
The California Geological Survey released official maps and reports of Seismic Hazard Zones affecting the cities of Sacramento, West Sacramento, Santa Rosa, Sebastopol, and Windsor, and the counties of Sacramento, Yolo, Contra Costa, Alameda, and Sonoma.
Seismic Hazard Zones are regulatory zones that encompass areas that have a potential for future ground deformations caused by liquefaction or landslides. These maps are released under the authority of the Seismic Hazards Mapping Act that was passed following the 1989 Loma Prieta earthquake. The Seismic Hazards Mapping Act is a state law designed to reduce the hazards from soil liquefaction and landslides during an earthquake.
In This Release
- Seismic Hazard Zone Report 141: Seismic Hazard Zone Report for the Sacramento West and Sacramento East 7.5-Minute Quadrangles; Sacramento and Yolo Counties, California
- Seismic Hazard Zone Report 142: Seismic Hazard Zone Report for the Byron Hot Springs 7.5-Minute Quadrangle, Contra Costa and Alameda Counties, California
- Seismic Hazard Zone Report 143: Seismic Hazard Zone Report for the Sebastopol 7.5-Minute Quadrangle, Sonoma County, California
- Four (4) Earthquake Zones of Required Investigation Maps (EZRIM).
Downloadable PDFs and Spatial Data
The maps, reports, and GIS shapefiles related to this release can be downloaded any time from our Information Warehouse Regulatory Maps Portal. If you wish to look up a specific parcel or address, we recommend our California Earthquake Hazards Zone application ('EQ Zapp').
Related Reference Material
- Reference Guide for Evaluating Seismic Hazards (Special Publication 117A: Guidelines for Evaluating and Mitigating Seismic Hazards in California). This document constitutes the guidelines for evaluating seismic hazards other than surface fault rupture, and for recommending mitigation measures as required by Public Resources Code Section 2695(a).
Map Sheet 68: Geologic map of the western Cady Mountains, San Bernardino County
August 17, 2025
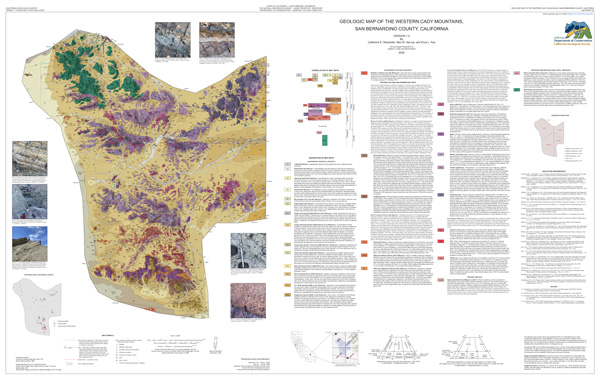 Map Sheet 68: Geologic map of the western Cady Mountains, San Bernardino County. Click the map for a high-resolution JPG image (opens new tab).
by Catherine Wesoloski, PG; Max Garvue; and Erica Key, PG
Map Sheet 68 is a 1:24,000-scale map of the geology of the western Cady Mountains, a potential source of critical minerals. The mapped area covers 55 square miles (142 square km). The project also produced three new Ar/Ar dates and 19 geochemical analyses.
Download Map Sheet 68 as a PDF (45 MB - opens new tab).
CALIFORNIA GEOLOGY™ Magazine volume 55
March 2025
The California Geological Survey is thrilled to announce the return of CALIFORNIA GEOLOGY magazine after a 23-year hiatus! This issue is a look back at 2024, and contains articles about California’s mineral resources, notable earthquakes, program updates, new maps and products, and contributions from our partners at Caltrans and the Department of Water Resources.
To download this release, visit the CALIFORNIA GEOLOGY 2024 web page.
DR 2024-1 - Data Release for the Del Norte Nickel-Cobalt Laterite Geochemical Reconnaissance Project
December 23, 2024
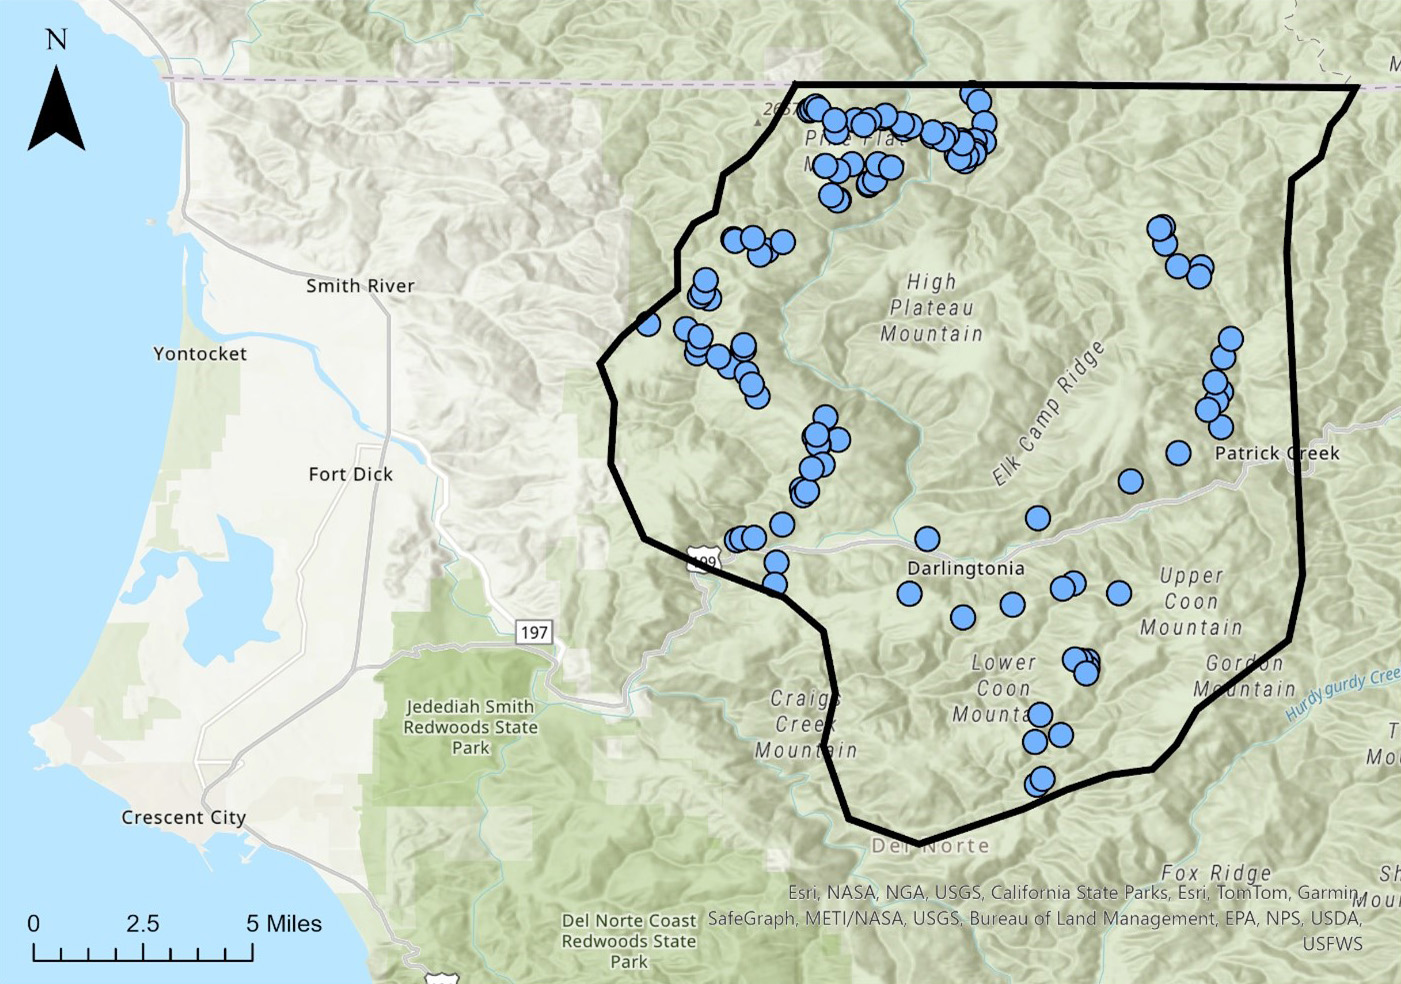 Map showing location and size of reconnaissance area (black outline), and distribution of sample locations (blue dots). Location: north-central Del Norte County. Size: roughly 15 miles across in all directions. There are approximately 90 sample locations, distributed toward the perimeter of the recon area.
by Ben Parrish, PG and Amy Tuzzolino, PG
The California Geological Survey's Mineral Resources Program conducted geochemical reconnaissance sampling of laterite and associated ultramafic rocks in Del Norte County as part of its statewide geochemical reconnaissance initiative. The goal of the sampling program is to collect data that will support current and future critical-mineral, precious-metal, base-metal, and industrial-mineral activities in California. Critical minerals as defined by the U.S. Department of Interior are mineral resources that are essential to our economy and national security and are at risk for supply disruption. The Del Norte County laterite deposits have historically been mined for nickel, cobalt, and chromium.
Samples from laterite and ultramafic rocks of the Josephine Ophiolite in Del Norte County were collected for geochemical analyses. Samples were selected to evaluate trace-element signatures and distribution in laterite deposits and compare trace-element concentration in underlying ultramafic rocks. Samples were also selected to evaluate laterite enrichment processes for nickel, cobalt, and chromium in these deposits.
To download this release, visit the Data Releases web page.
Maps for New and Revised Earthquake Fault Zones in Six Counties
November 21, 2024
 Index maps showing outlines of the Earthquake Fault Zone maps in this release. Click an image to open a larger version in a new window.
The California Geological Survey released maps and reports of new and revised Alquist-Priolo Earthquake Fault Zones to the cities of Palo Alto and Ridgecrest, the towns of Portola Valley and Woodside, and the counties of Inyo, Kern, Los Angeles, San Bernardino, San Mateo, and Santa Clara. These maps are released under the authority of the Alquist-Priolo Earthquake Fault Zoning Act (Alquist-Priolo Act) that was passed following the 1971 San Fernando earthquake. The Alquist-Priolo Act is a state law designed to reduce the hazard from surface fault rupture during an earthquake.
Earthquake Fault Zones are regulatory zones that encompass surface traces of active faults that have a potential for future surface fault rupture.
In This Release
- Fault Evaluation Report 268: The San Andreas Fault Zone in the San Mateo, Woodside, Palo Alto, and Mindego Hill 7.5-Minute Quadrangles, San Mateo and Santa Clara Counties, California
- Fault Evaluation Report 273: The San Andreas Fault Zone in the Burnt Peak, Lake Hughes, and Del Sur 7.5-Minute Quadrangles, Los Angeles County, California
- Fault Evaluation Report 274: The Paxton Ranch and Salt Wells Valley Fault Zones, with Modifications to the Airport Lake and Little Lake Fault Zones in the White Hills, Burro Canyon, Ridgecrest North, Lone Butte, Westend, Spangler Hills West, Spangler Hills East, and Christmas Canyon 7.5-Minute Quadrangles, Inyo, Kern, and San Bernardino Counties, California
- Fifteen (15) Earthquake Zones of Required Investigation Maps (EZRIM).
Downloadable PDFs and Spatial Data
The maps, reports, and GIS shapefiles related to this release can be downloaded any time from our Information Warehouse Regulatory Maps Portal. If you wish to look up a specific parcel or address, we recommend our California Earthquake Hazards Zone application ('EQ Zapp').
Related Reference Material
- Reference Guide for Assessing Fault Rupture Hazards (Special Publication 42: Earthquake Fault Zones - A Guide for Government Agencies, Property Owners/Developers, and Geoscience Practitioners for Assessing Fault Rupture Hazards in California). This document contains technical guidelines for evaluating surface fault rupture hazards and for reviewing geologic reports.
Maps for New Seismic Hazard Zones in Contra Costa County
November 21, 2024
 Index map showing outlines of the Seismic Hazard Zone maps in this release. Click the image to open a larger version in a new window.
The California Geological Survey (CGS) released maps and reports of new Seismic Hazard Zones to the cities of Concord, Danville, El Cerrito, Hercules, Lafayette, Martinez, Pinole, Pleasant Hill, Richmond, San Pablo, San Ramon, and Walnut Creek, and the county of Contra Costa. These maps are released under the authority of the Seismic Hazards Mapping Act that was passed following the 1989 Loma Prieta earthquake. The Seismic Hazards Mapping Act is a state law designed to reduce the hazards from soil liquefaction and landslides during an earthquake.
Seismic Hazard Zones are regulatory zones that encompass areas that have a potential for future ground deformations caused by liquefaction or landslides.
In This Release
- Seismic Hazard Zone Report 138: Seismic Hazard Zones in the Benicia and Briones Valley 7.5-Minute Quadrangles; Contra Costa County, California
- Seismic Hazard Zone Report 139: Seismic Hazard Zones in the Oakland East and Las Trampas Ridge 7.5-Minute Quadrangles, Contra Costa County, California
- Seismic Hazard Zone Report 140: Seismic Hazard Zones in the Hayward, Dublin, and Livermore 7.5-Minute Quadrangles, Contra Costa County, California
- Seven (7) Earthquake Zones of Required Investigation Maps (EZRIM).
Downloadable PDFs and Spatial Data
The maps, reports, and GIS shapefiles related to this release can be downloaded any time from our Information Warehouse Regulatory Maps Portal. If you wish to look up a specific parcel or address, we recommend our California Earthquake Hazards Zone application ('EQ Zapp').
Related Reference Material
- Reference Guide for Evaluating Seismic Hazards (Special Publication 117A: Guidelines for Evaluating and Mitigating Seismic Hazards in California). This document constitutes the guidelines for evaluating seismic hazards other than surface fault rupture, and for recommending mitigation measures as required by Public Resources Code Section 2695(a).
Bulletin 232 - California Non-Fuel Mineral Production 2022
September 27, 2024
by Greg D. Marquis
California remained one of the largest producers of non-fuel minerals in the United States in 2022. This report discusses the commodities produced as well as production and trends for many commodities.
To obtain the full report, visit the
California Mineral Production web page.
Map Sheet 67 - Cumulative ShakeMap of California from 1981 to 2023
September 21, 2024
Geologic Data Map 8 - California Strong Motion Instrumentation Program Network Stations (2024)
June 30, 2024
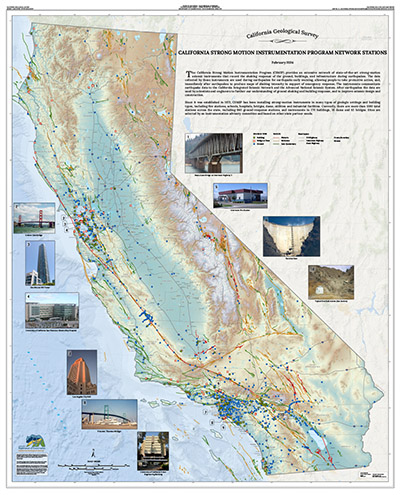
Since it was established in 1972, the CGS' Strong Motion Instrumentation Program has been installing strong-motion instruments in many types of geologic settings and building types, including fire stations, schools, hospitals, bridges, dams, utilities and industrial facilities. Currently, there are more than 1,380 such stations across the state of California.
These instruments record and communicate the shaking response of the ground, buildings, and other infrastructure during earthquakes. The data collected are used almost instantly to generate Earthquake Early Warning alerts, and to produce ShakeMaps which support emergency response in the minutes following an earthquake. The data are also used by scientists and engineers to further their understanding of ground shaking and building response, and to improve seismic design and construction of infrastructure.
Download Geologic Data Map 8 - California Strong Motion Instrumentation Program Network Stations (2024).
Special Report 258 - Radon Potential in Western Nevada County, California
May 3, 2024

by Greg D. Marquis
This report documents the data and procedures used by the California Department of Conservation, California Geological Survey (CGS) to develop the 2024 radon potential zone map for western Nevada County (Plate 1). The CGS produced the map for the California Department of Public Health-Indoor Radon Program through an interagency agreement. The findings provided in this report are based on the association between indoor radon in homes and the underlying geology. The report includes radon potentials for individual geologic units using the percentage of indoor radon measurements ≥ 4.0 picocuries per liter.
Special Report 258 and its associated plate (map) are available as free downloads at the Department of Conservation's File Request application.
Radon is a naturally occurring radioactive gas that is invisible and odorless. Breathing air with elevated levels of radon gas results in an increased risk of developing lung cancer. Learn more about radon.
Special Report 256 - Radon Potential in Western El Dorado County, California
March 6, 2024
by Greg D. Marquis
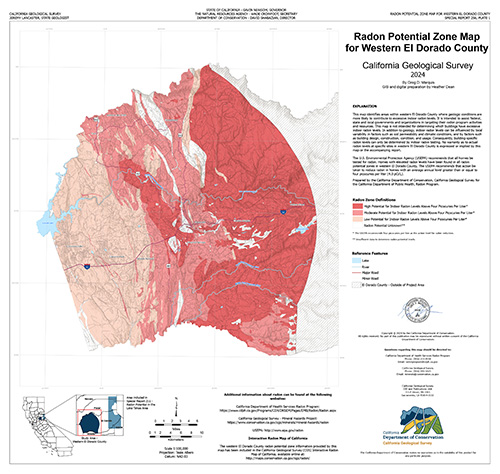
This report documents the data and procedures used by the California Department of Conservation, California Geological Survey (CGS) to develop the 2024 radon potential zone map for western El Dorado County (Plate 1). The CGS produced the map for the California Department of Public Health-Indoor Radon Program through an interagency agreement. The findings provided in this report are based on the association between indoor radon in homes and the underlying geology. The report includes radon potentials for individual geologic units using the percentage of indoor radon measurements ≥ 4.0 picocuries per liter.
Special Report 256 and its associated plate (map) are available as free downloads at the Department of Conservation's File Request application.
Radon is a naturally occurring radioactive gas that is invisible and odorless. Breathing air with elevated levels of radon gas results in an increased risk of developing lung cancer. Learn more about radon.
Official Maps for Revised Earthquake Fault Zones in Sonoma County
February 22, 2024
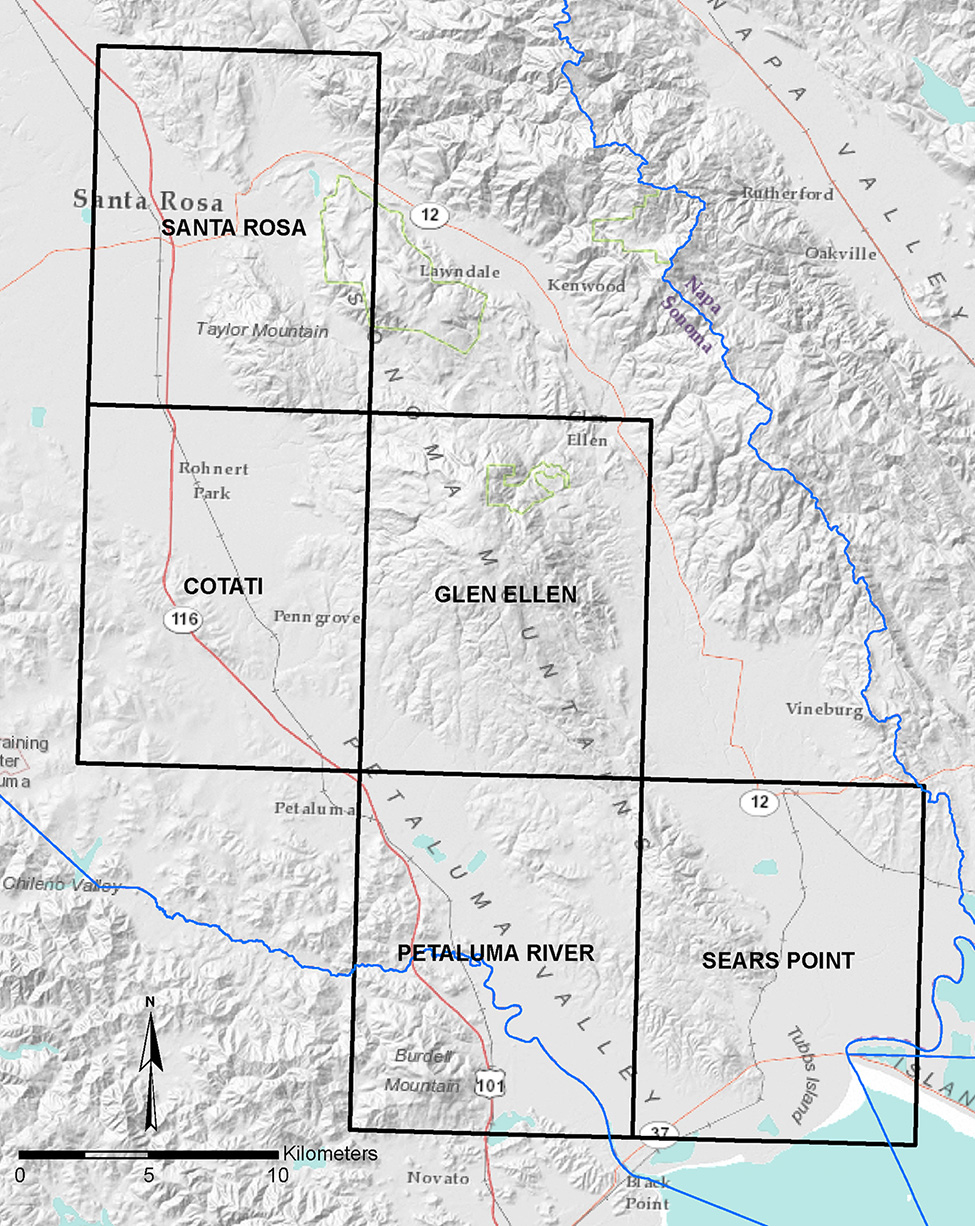 Index map showing locations of the Earthquake Fault Zone maps included in this release.
The California Geological Survey (CGS) released official maps and reports of revised Alquist-Priolo Earthquake Fault Zones to the city of Santa Rosa and the county of Sonoma. These maps are released under the authority of the Alquist-Priolo Earthquake Fault Zoning Act (Alquist-Priolo Act) that was passed following the 1971 San Fernando earthquake. The Alquist-Priolo Act is a state law designed to reduce the hazard from surface fault rupture during an earthquake.
Earthquake Fault Zones are regulatory zones that encompass surface traces of active faults that have a potential for future surface fault rupture.
In This Release
- Fault Evaluation Report 270: The Southern Rodgers Creek Fault Zone in the Sears Point, Petaluma River, Glen Ellen, Cotati, and Santa Rosa 7.5-minute quadrangles; Sonoma County, California
- Five (5) Earthquake Zones of Required Investigation Maps (EZRIM).
Downloadable PDFs and Spatial Data
The maps, reports, and GIS shapefiles related to this release can be downloaded any time from our Information Warehouse Regulatory Maps Portal. If you wish to look up a specific parcel or address, we recommend our California Earthquake Hazards Zone application ('EQ Zapp').
Related Reference Material
- Reference Guide for Assessing Fault Rupture Hazards (Special Publication 42: Earthquake Fault Zones - A Guide for Government Agencies, Property Owners/Developers, and Geoscience Practitioners for Assessing Fault Rupture Hazards in California). This document contains technical guidelines for evaluating surface fault rupture hazards and for reviewing geologic reports.
Official Maps for New Seismic Hazard Zones in Contra Costa County
February 22, 2024
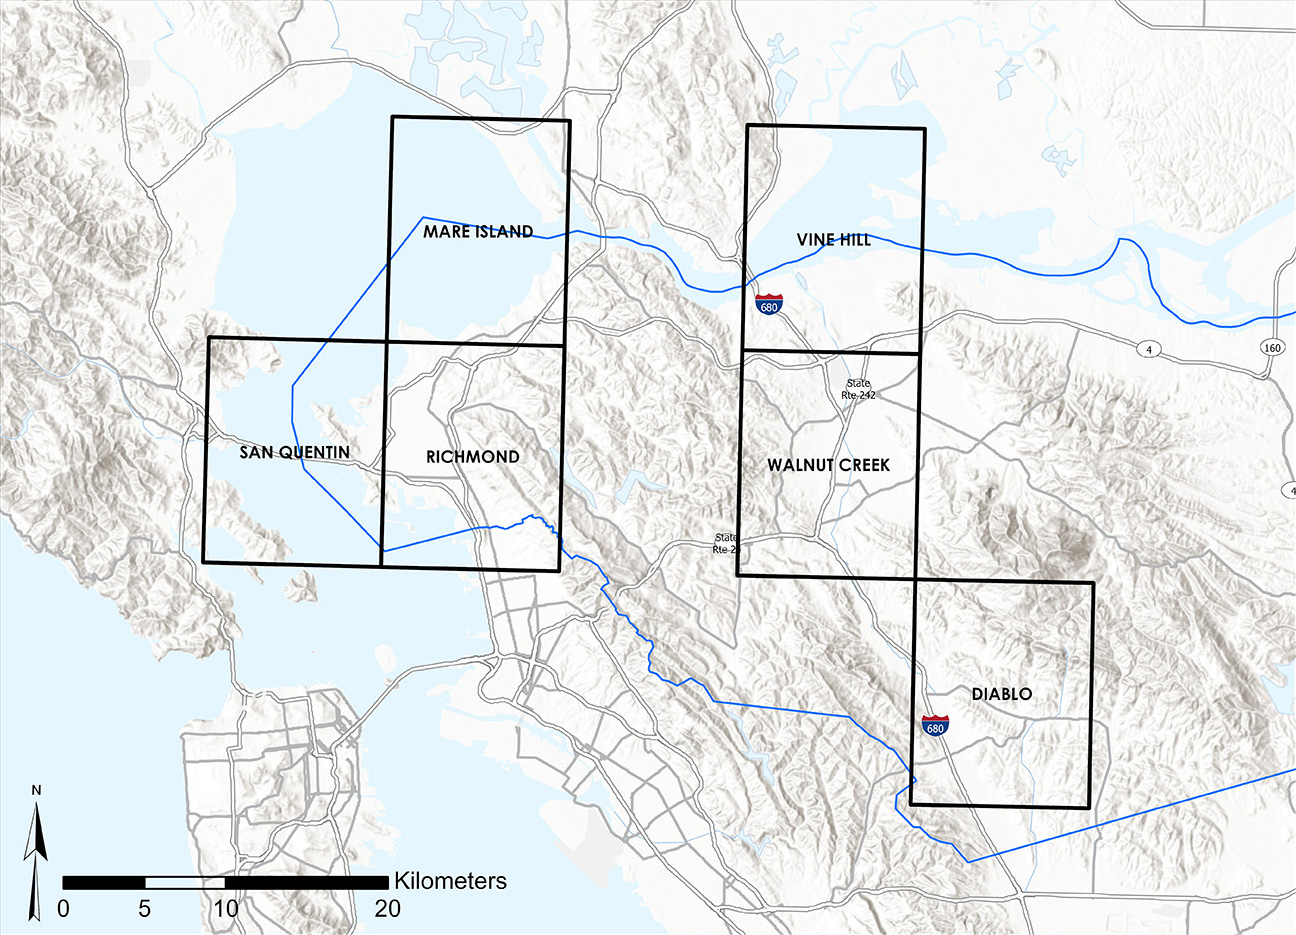 Index map showing locations of the Seismic Hazard Zone maps included in this release.
The California Geological Survey (CGS) released maps and reports of new Seismic Hazard Zones to the cities of Concord, Danville, El Cerrito, Hercules, Lafayette, Martinez, Pinole, Pleasant Hill, Richmond, San Pablo, San Ramon, and Walnut Creek, and the county of Contra Costa. These maps are released under the authority of the Seismic Hazards Mapping Act that was passed following the 1989 Loma Prieta earthquake. The Seismic Hazards Mapping Act is a state law designed to reduce the hazards from soil liquefaction and landslides during an earthquake.
Seismic Hazard Zones are regulatory zones that encompass areas that have a potential for future ground deformations caused by liquefaction or landslides.
In This Release
- Seismic Hazard Zone Report 134: Seismic Hazard Zones in the Richmond, Mare Island, and San Quentin 7.5-minute quadrangles; Contra Costa County, California
- Seismic Hazard Zone Report 135: Seismic Hazard Zones in the Vine Hill 7.5-minute quadrangle, Contra Costa County, California
- Seismic Hazard Zone Report 136: Seismic Hazard Zones in the Walnut Creek 7.5-minute quadrangle, Contra Costa County, California
- Seismic Hazard Zone Report 137: Seismic Hazard Zones in the Diablo 7.5-minute quadrangle, Contra Costa County, California
- Six (6) Earthquake Zones of Required Investigation Maps (EZRIM).
Downloadable PDFs and Spatial Data
The maps, reports, and GIS shapefiles related to this release can be downloaded any time from our Information Warehouse Regulatory Maps Portal. If you wish to look up a specific parcel or address, we recommend our California Earthquake Hazards Zone application ('EQ Zapp').
Related Reference Material
- Reference Guide for Evaluating Seismic Hazards (Special Publication 117A: Guidelines for Evaluating and Mitigating Seismic Hazards in California). This document constitutes the guidelines for evaluating seismic hazards other than surface fault rupture, and for recommending mitigation measures as required by Public Resources Code Section 2695(a).
Special Report 257 - Surface Rupture Mapping of the 2019 M6.4 and M7.1 Ridgecrest Earthquake Sequence on Lidar and Orthoimagery
February 2, 2024
by Carla Rosa, Timothy Dawson, and Reva Kakaria
Summary of SR 257
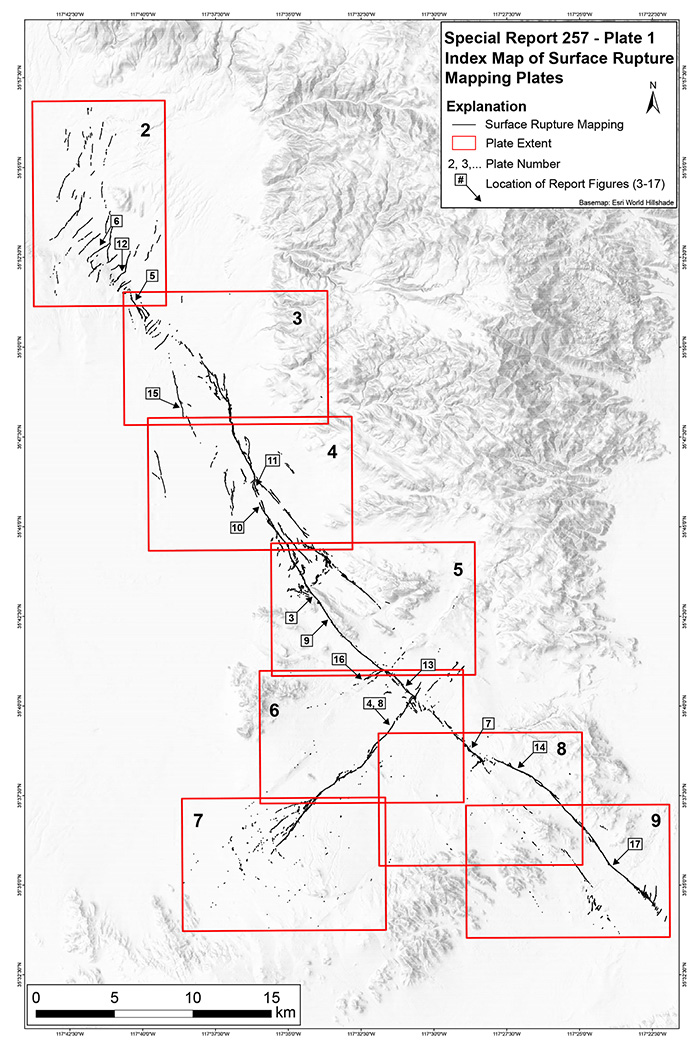
Surface fault ruptures are the primary evidence of large earthquakes, and documenting observations from these events is important for better understanding of fault mechanics, fault displacement, and seismic hazard and risk assessment for life-safety and property. The MW
6.4 and MW 7.1 2019 Ridgecrest Earthquake Sequence produced complex surface rupture and ground deformation along two distinct fault zones with mapped rupture lengths extending 18 km and 50 km, respectively. Both fault zones consist of primary fault strands with linear cracks continuous along strike, broad regions of distributed fractures, and well-defined scarps as high as 3 meters.
Immediate post-earthquake field reconnaissance by others (Hudnut et al.) provided medium- to high-resolution aerial lidar and airborne optical imagery along the rupture. Using orthoimages and hillshades derived from these data, the California Geological Survey (CGS) produced a comprehensive surface rupture map documenting visible features with qualitative descriptions and an associated catalog of attributes. When compared with previous mapping datasets, features mapped in the CGS dataset generally have greater location accuracy and more specificity to fine-scale expression, including some previously undocumented deformation.
This investigation of the Ridgecrest Earthquake Sequence ruptures demonstrates the utility for detailed mapping of coseismic earthquake rupture using uniform high-resolution imagery and topographic data collected immediately post-event. The CGS dataset of surface rupture features will be potentially useful for longer term, geomorphic-based fault evaluation and studies of rupture patterns.
Data Resources
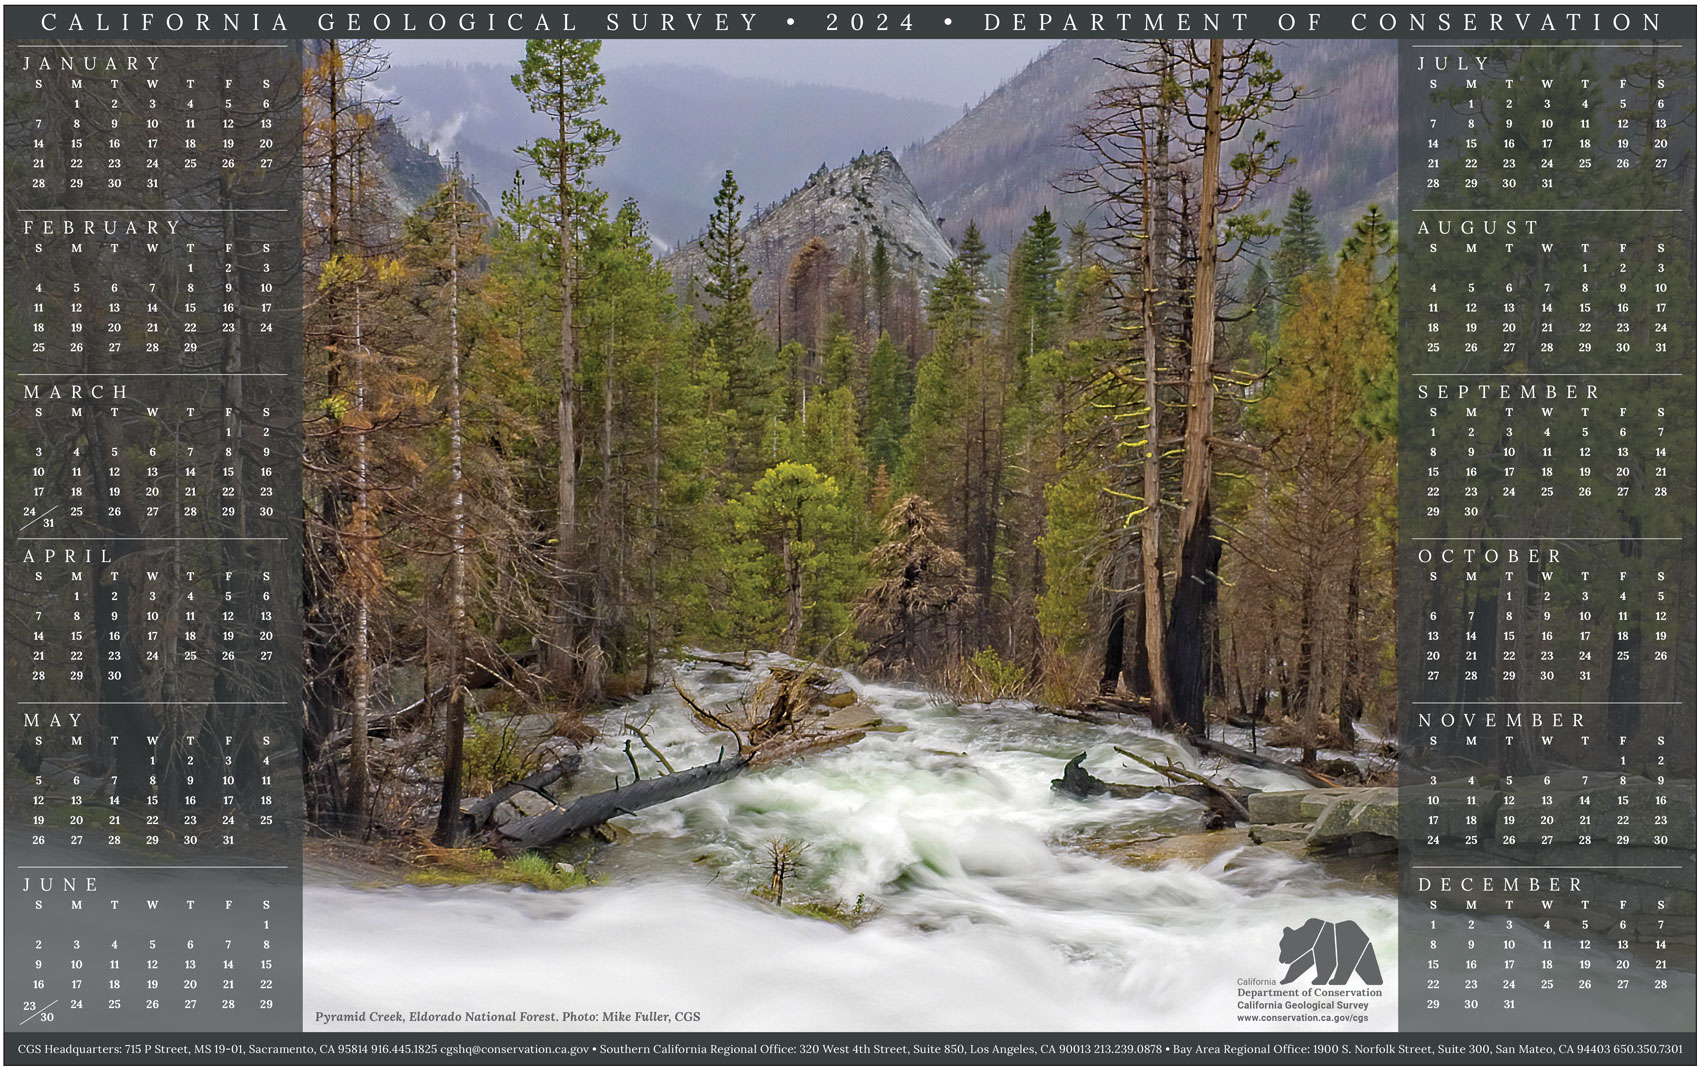
2024 California Geological Survey Calendar
December 14, 2023
by Mike Fuller and Rob Wurgler
The 2024 California Geological Survey calendar is available in two versions. Visit our CGS Calendar page to preview the calendar and download a printable version.
Regional Geologic Map No. 5 - Geologic and Geophysical Maps of the Stockton 30' x 60' Quadrangle
September 12, 2023
Compiled by M.P. Delattre, R.W. Graymer, V.E. Langenheim, K.L. Knudsen, T.E. Dawson, E.E. Brabb, C.M. Wentworth, and L.A. Raymond
This release consists of two PDF files: a 79-page pamphlet and one plate measuring 60 inches by 35 inches. The plate contains several map layers that can be enabled and disabled in a PDF-compatible application. The map layers depict general geology, faults, landslides, gravity and aeromagnetic anomalies, topographic contours and relief, and more.
To obtain the pamphlet and plate, visit
 California Regional Geologic Maps web page.
The pamphlet and accompanying geologic and geophysical maps are the products of cooperative efforts by the California Geological Survey and United States Geological Survey to compile a comprehensive, digital representation of the bedrock geology, Quaternary surficial deposits, and potential-field anomalies within the boundaries of the Stockton 30' × 60' quadrangle. The Stockton 30' × 60' quadrangle covers approximately 4,890 square kilometers of Contra Costa, Alameda, San Joaquin, and Stanislaus Counties in California. From the rugged hillsides of the northern Diablo Range in the west to the San Joaquin Valley in the east, the map extends roughly 88 kilometers across growing suburban communities of the eastern San Francisco Bay Area and Livermore Valley, grass-covered ranchlands along eastern slopes of the Diablo Range, and into the low farmlands of the San Joaquin Valley and Sacramento-San Joaquin River Delta. The elevation ranges from near sea level in the Delta to 1,173 meters on Mount Diablo, the most prominent peak of the San Francisco Bay region.
The Stockton 30' × 60' geologic map compilation is intended to illustrate the distribution of the rocks and surficial deposits of the area and their structural and stratigraphic relations to one another. The larger goal of the publication is to provide a regionally consistent picture of the geologic and geophysical framework to better understand the structural and stratigraphic relations across the region as an aid to natural resources management and evaluations of potential hazards from active earth processes.
The geologic map was compiled predominantly from 1:24,000- and 1:62,500-scale mapping. Although the map sheet was cartographically designed and formatted for display at 1:100,000-scale, details of the larger scale source maps were retained in the digital geodatabase. As a digital product, the map may be easily enlarged; however, the spatial accuracy of the data remains limited to that of the source maps. Similarly, the age and scale of topographic base maps used for the original mapping should be considered when overlying the digital compilation on newer base maps, which may produce apparent spatial discrepancies. Accordingly, it is important to recognize that neither the printed map sheet nor digital database is sufficiently detailed or spatially accurate to serve as a basis for site-specific evaluations.
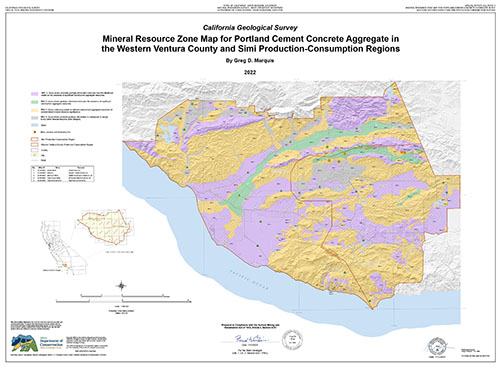
Special Report 253 - Mineral Land Classification: Portland Cement Concrete Aggregate in the Western Ventura County and Simi Production-Consumption Regions
November 22, 2022
by Greg D. Marquis
Summary of SR 253
SR 253 is the second update Mineral Land Classification (MLC) report for Portland cement concrete (PCC) aggregate in Ventura County. The original MLC report was published as SR 145 in 1981. The first update was published as Open-File Report 93-10 in 1993. SR 253 reevaluates PCC aggregate resources, permitted reserves, past production, and includes an updated 50-year projection (through the year 2067) of demand for PCC and all other grades of construction aggregate in the Western Ventura-Simi Production-Consumption Regions.
The following list summarizes some of the major findings and conclusions reached in this update report:
- Of the 27,179 acres of Designated Sectors in the WVS P-C Regions, 1,674 acres (6.2 percent) were lost due to land uses incompatible with mining.
- There are an estimated 5,593 million tons of PCC resources in the WVS P-C Regions. 118 million tons are currently permitted.
- The 118 million tons of permitted PCC aggregate reserves could last less than 23 years.
- The WVS P-C Regions PCC aggregate reserves are approximately 80 percent fine and 20 percent coarse.
- Approximately 25 percent of aggregate (coarse PCC aggregate) was imported to the WVS P-C Regions in 2017.
- Imports to the WVS P-C Regions are transported at least 40 miles, which increases costs and greenhouse gas emissions.
- Barriers to future mine permitting include housing, parks, environmental policies and land use decisions protecting wildlife habitat.
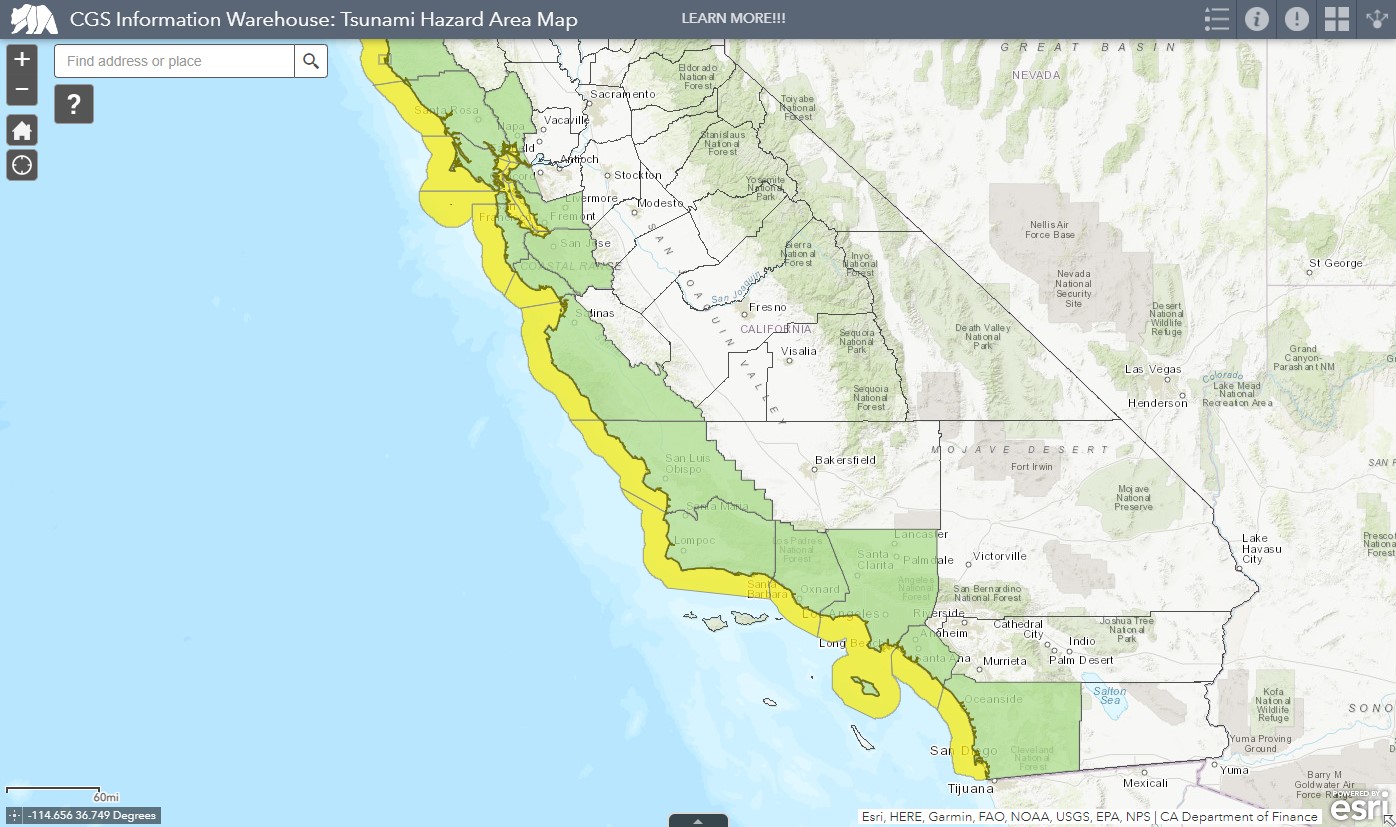
New Tsunami Hazard Area Maps for Seven Counties
October 7, 2022
by Rick I. Wilson, Jaqueline D. Bott, Nicholas G. Graehl, Jason R. Patton, Kate Thomas, Michael Falsetto, and Bob Moskovitz
Today the CGS issued new Tsunami Hazard Area (THA) maps for the counties of San Diego, Ventura, Santa Cruz, Marin, Sonoma, Napa, and Solano. This release completes THA mapping for the entire coast of California.
THA maps show areas that could be exposed to inundation during a tsunami event, and are useful for planning damage mitigation and emergency response activities. They are available to the public in several formats: an interactive web map; downloadable PDF files; downloadable KMZ files; a downloadable package of shapefiles for GIS; and a web map service for GIS. Follow this link to explore the new California Tsunami Maps and Data.
For more information about tsunamis in California, visit our Tsunamis landing page.
Special Report 247 - California Indoor Radon Potential
August 2, 2022
by Ronald K. Churchill, Joshua A. Goodwin, and Brenda L. Callen
This report summarizes indoor radon data available up to 2018 for each county in the state of California, using information provided by the California Department of Public Health through an interagency agreement. The report is available as a single PDF file, which can be viewed using Adobe Acrobat Reader. Follow this link to download Special Report 247.
NOTE: Clicking the link above will take you to our File Request system, where you will need to provide your email address; other than that the process is quick, and you receive a file link within five minutes of requesting it.
For more information about indoor radon in California, visit our Indoor Radon page.
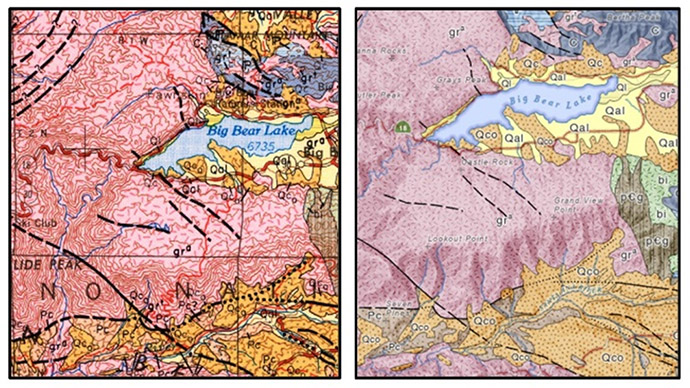
California Geologic Atlas Map Series (Digitized)
July 28, 2022
by Rachel Beard, Dan Wills, Eric Montes, Chris Henningfeld, and Carlos Gutierrez
The California Geologic Atlas Map series (250k scale) is now available as digitized, spatially corrected, and GeMS-compliant geospatial data. We expect this announcement will be of special interest to GIS users and others who rely on GIS to support decision-making.
Although this series was published on paper more than 50 years ago, in many areas of the state it's still the best available geologic mapping, and is frequently used by the CGS for reference on Timber Harvesting Plan reviews, WERT responses, and more.
The Geologic Atlas Map series consists of:
- 28 quadrangles mapped at 1:250,000 scale, covering the entire state of California
- 28 Explanations of Map Units
- 28 Level 3 GeMS-compliant databases
- 85 Geologic units and many sub-units
- 66,784 Geologic unit polygons
- 95,376 Contact and fault lines
- Additional mapped and attributed features such as volcanic cinder cones, fossil localities, radiometric age dates, oil seeps, and more.
The maps have been available for many years as PDF and georeferenced TIFF; now they are also available as shapefiles and geodatabase files. All of the original maps were carefully digitized, spatially corrected, attributed, quality controlled, and validated for Level 3 GeMS compliance, resulting in a final product that is a faithful digital reproduction of the original. To download the files, visit our Regional Geologic Maps page.
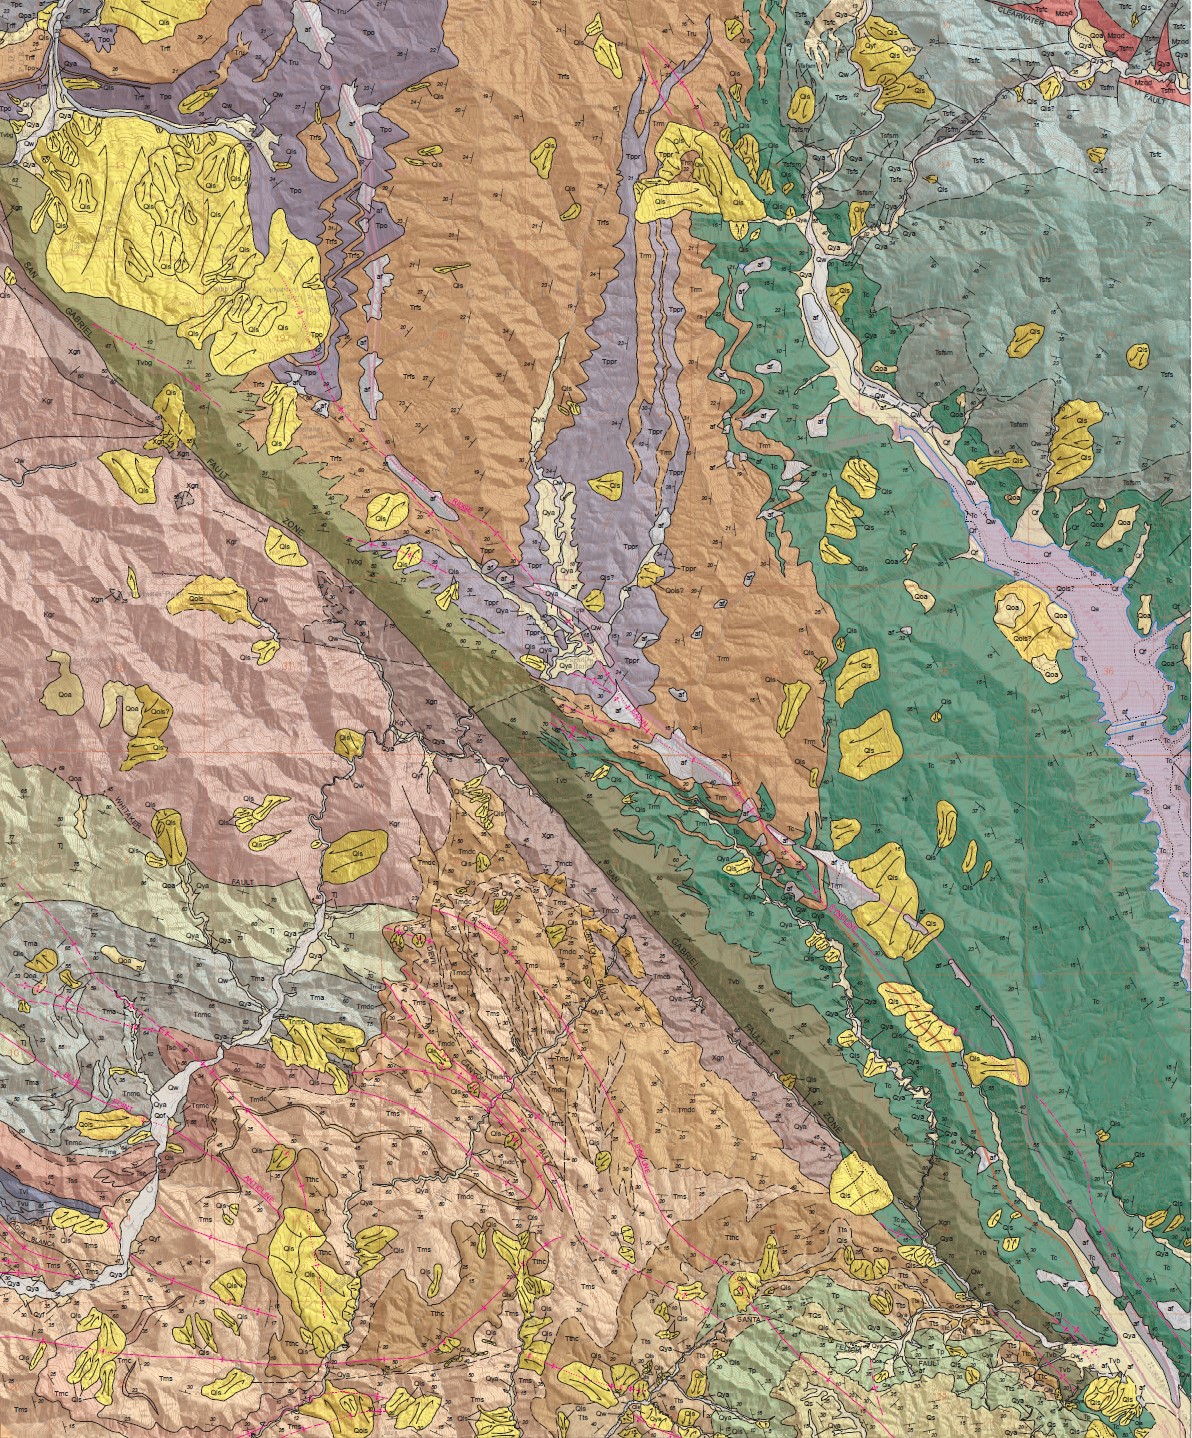
Preliminary Geologic Maps of the New York Mountains Region
July 13, 2022
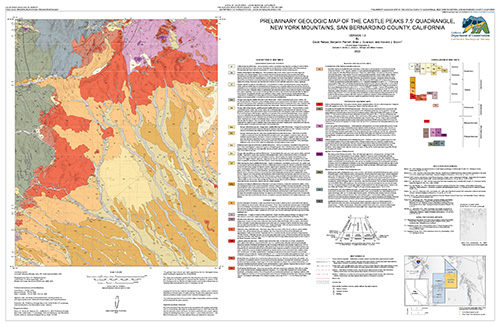
by David Reioux, Benjamin Parrish, Brian J. Swanson, and Howard J. Brown
The California Geological Survey (CGS) released four new preliminary geologic maps, supported by the United States Geological Survey's (USGS) Earth Mapping Resource Initiative (Earth MRI) within the Mountain Pass Rare Earth Element Focus Area. The maps are:
- Preliminary geologic map of the Crescent Peak 7.5-minute quadrangle, New York Mountains, San Bernardino County, California
- Preliminary geologic map of the Castle Peaks 7.5-minute quadrangle, New York Mountains, San Bernardino County, California
- Preliminary geologic map of the Ivanpah 7.5-minute quadrangle, New York Mountains, San Bernardino County, California
- Preliminary geologic map of the Pinto Valley 7.5-minute quadrangle, New York Mountains, San Bernardino County, California
(BELOW) Index map showing the project location and the quadrangles included in this release.
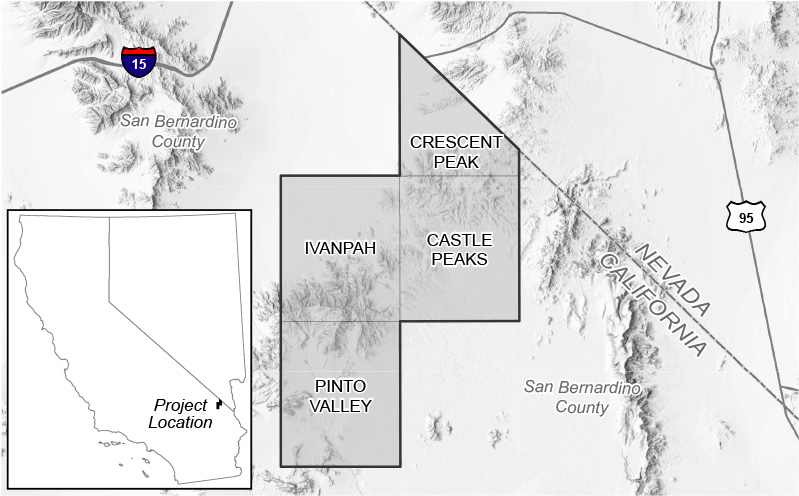
Project Background
In 2019, the CGS entered into a cooperative agreement with the USGS to conduct geologic mapping of the New York Mountains at 1:24,000 scale. This project is supported in part by funding from the USGS and occurs within the Mountain Pass Rare Earth Element Focus Area. The field area was selected due to its proximity to the world class, carbonatite-hosted, light rare earth deposit at Mountain Pass.
Rare earth elements are among 50 minerals listed as critical by the USGS. Critical minerals are defined as being essential for manufacturing products significantly important to the economy and national security and as having supply chains vulnerable to outside disruption. The Earth MRI Project aims to gather information to identify potential domestic sources of critical minerals.
Downloadable Files Related to this Release
The maps are available as PDF files, which can be viewed using Adobe Acrobat Reader. To download these maps, visit our Preliminary Geologic Maps page.
Special Report 254 - Update of the Mineral Land Classification for Portland Cement Concrete Aggregate Resources in the San Fernando Valley and Saugus-Newhall Production-Consumption Regions
February 16, 2022
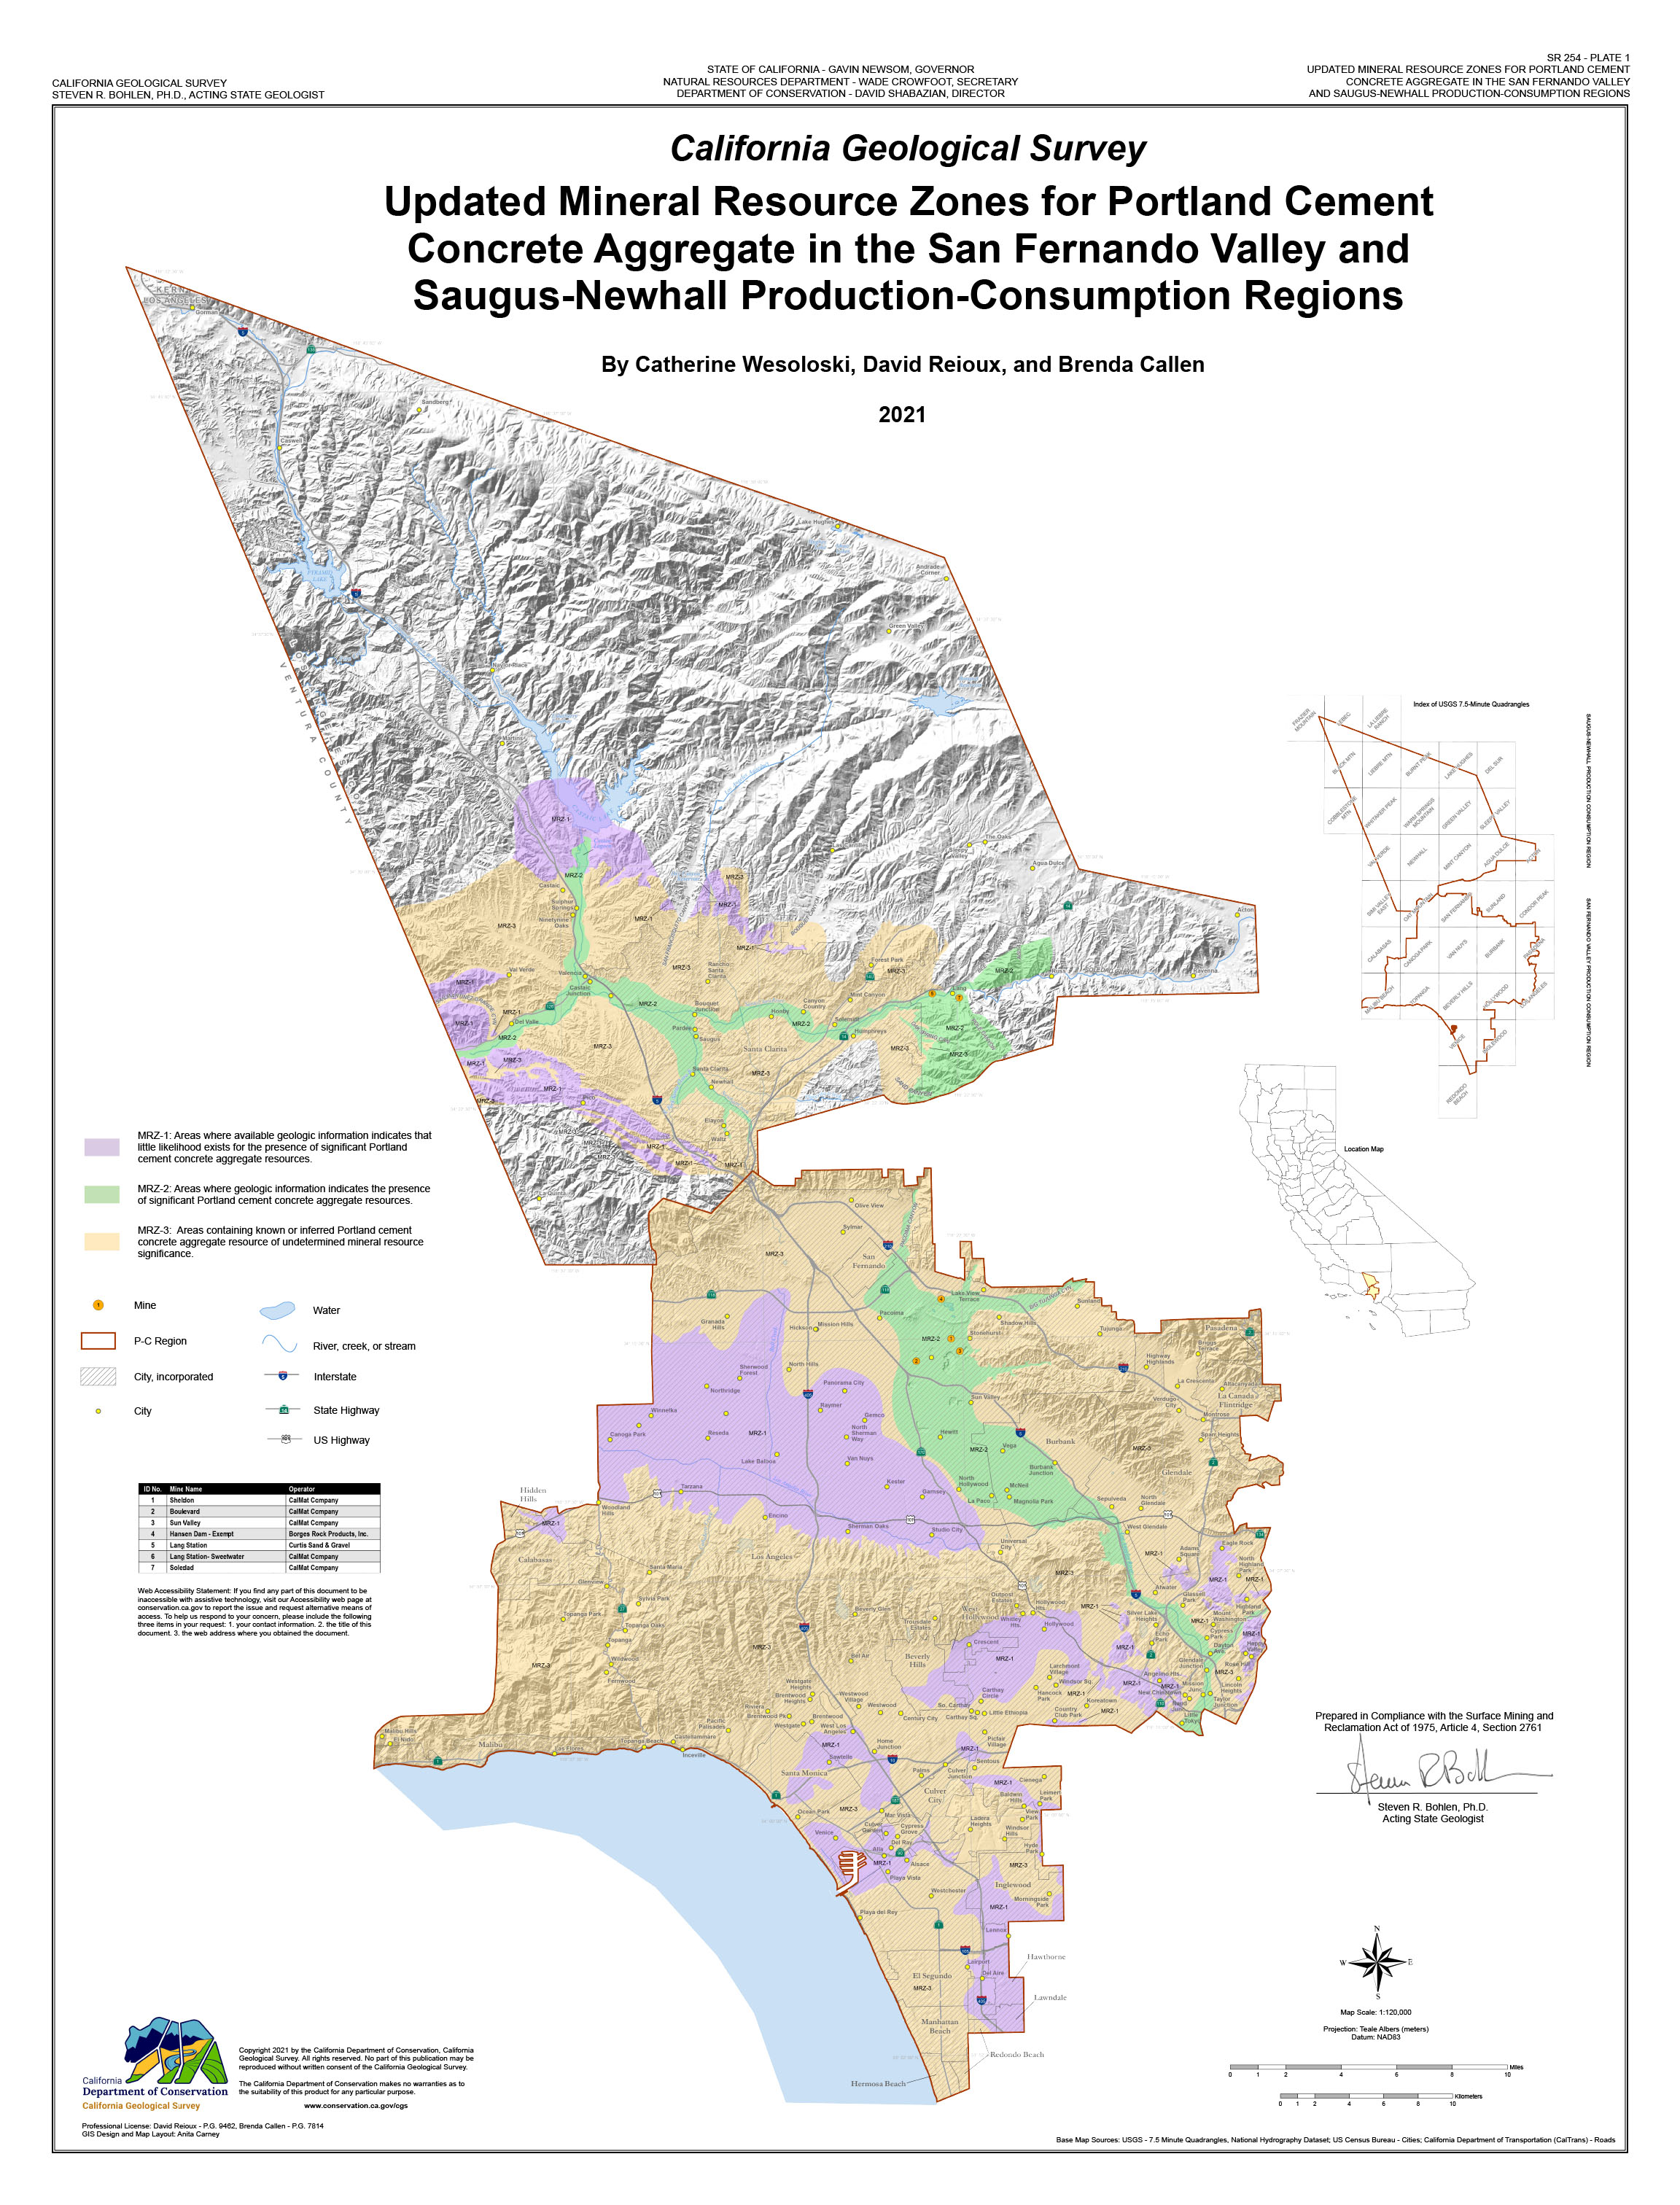
by Catherine Wesoloski, David Reioux, and Brenda Callen
Summary of SR 254
This report, Special Report (SR) 254, serves as an update to the findings presented in SR 143 parts I, II (Anderson and others, 1979), and V (Joseph and others, 1987) and Open-File Report (OFR) 94-14 (Miller, 1994). It includes: 1) a reevaluation of Portland cement concrete (PCC) aggregate resources within the San Fernando Valley and Saugus-Newhall Production-Consumption (P-C) Regions; 2) estimates for the quantity of resources as of December 2018; and, 3) a 50-year forecast of PCC aggregate demand within the San Fernando Valley and Saugus-Newhall P-C Regions from 2018 to 2068.
The major findings are:
- No new sectors were added; the four sectors classified in the San Fernando Valley P-C Region and the three sectors classified in the Saugus-Newhall P-C Region were maintained from SR 143 and OFR 94-14.
- The projected 50-year PCC aggregate demand on the San Fernando Valley P-C Region through the year 2068 is estimated to be 959 million tons.
- The projected 50-year PCC aggregate demand on the Saugus-Newhall P-C Region through the year 2068 is estimated to be 80 million tons.
- Reserves are proprietary but will be exhausted in less than 10 years in both regions if the current demand is sustained.
- Approximately 416 million tons of resources underlie the San Fernando Valley P-C Region.
- Approximately 10.5 billion tons of resources underlie the Saugus-Newhall P-C Region.
- If no additional reserves become available, both the San Fernando Valley and Saugus-Newhall P-C Regions will remain dependent on external sources of PCC aggregate.
Preliminary Geologic Maps for Quadrangles in Los Angeles, Mendocino, San Luis Obispo, Stanislaus, and Ventura Counties
October 27, 2021
The California Geological Survey released new preliminary geologic maps for the following quadrangles:
- Oakdale 100k east half (Stanislaus county)
- San Luis Obispo 100k west half (San Luis Obispo county)
- Redwood Valley 24k (Mendocino county)
- Black Mountain 24k (Los Angeles and Ventura counties)
- Whitaker Peak 24k (Los Angeles and Ventura counties)
The maps are available as PDF files only. To download them, visit our Preliminary Regional Geologic Maps page.
Official Maps for New and Revised Earthquake Fault Zones in San Diego and Ventura Counties
September 23, 2021
(BELOW) Index maps showing locations of the Earthquake Fault Zone maps included in this release.
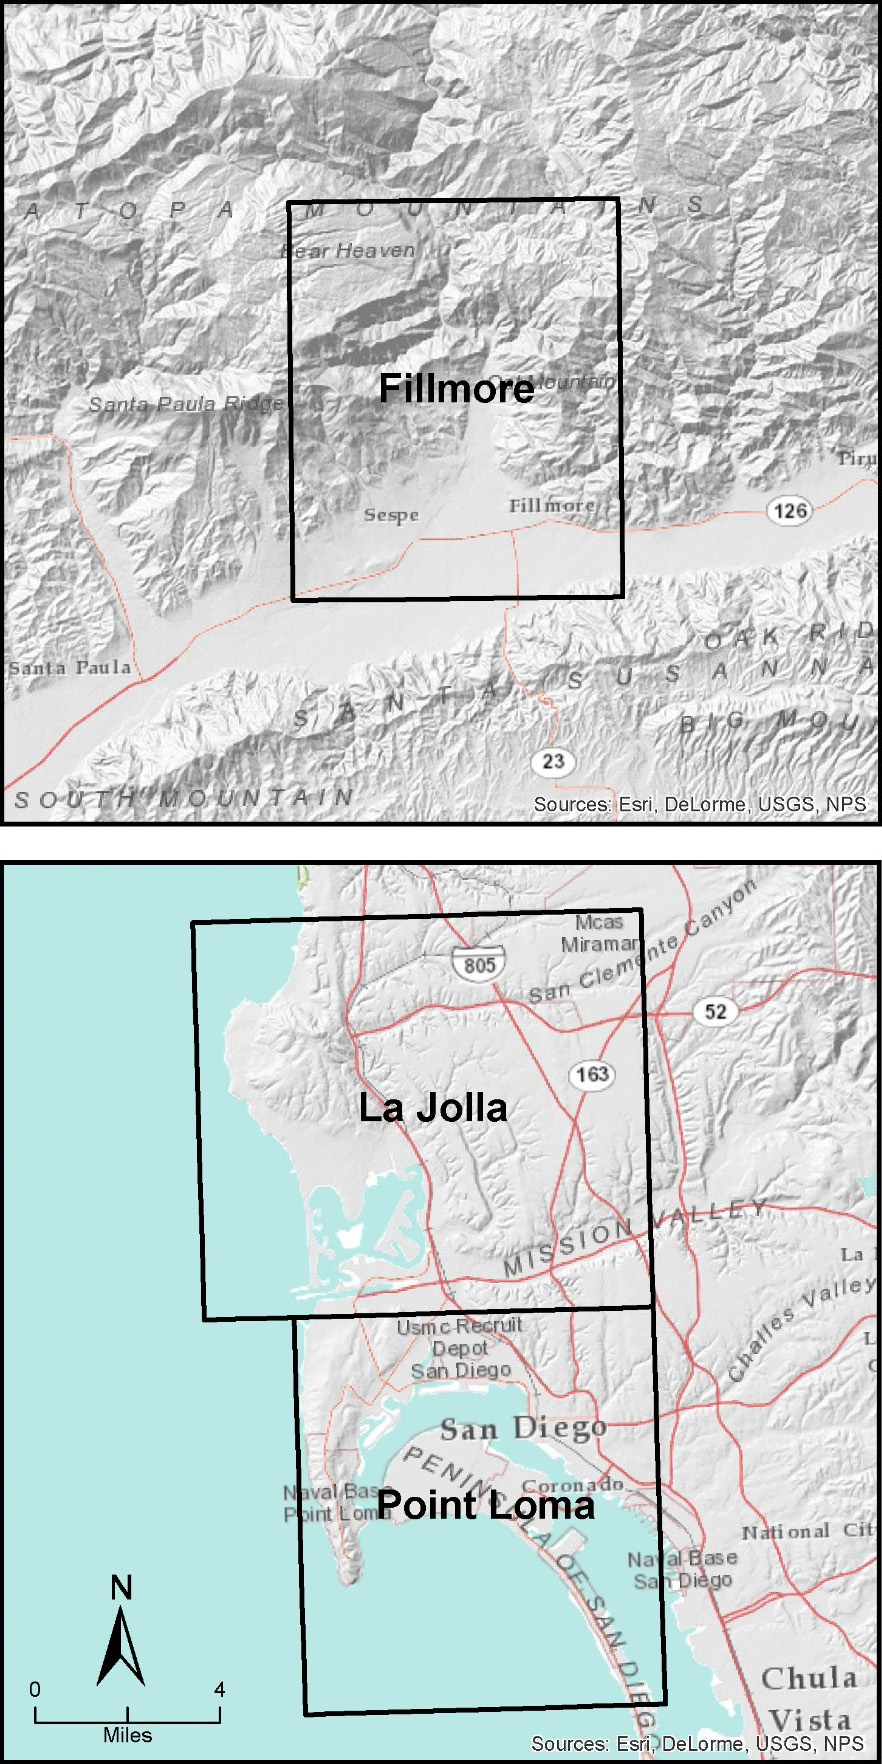
The California Geological Survey (CGS) released official maps and reports of new and revised Alquist-Priolo Earthquake Fault Zones to the cities of Fillmore and San Diego, and the counties of San Diego and Ventura.
These maps are released under the authority of the Alquist-Priolo Earthquake Fault Zoning Act (Alquist-Priolo Act) that was passed following the 1971 San Fernando earthquake. The Alquist-Priolo Act is a state law designed to reduce the hazard from surface fault rupture during an earthquake.
Earthquake Fault Zones are regulatory zones that encompass surface traces of active faults that have a potential for future surface fault rupture.
The maps and reports are available as PDF files, which can be viewed using Adobe Acrobat Reader. To download these maps and reports, follow the links provided below.
Downloadable Files Related to this Release
Point Loma and La Jolla (San Diego County)
Fillmore (Ventura County)
Reference Guide for Assessing Fault Rupture Hazards
Spatial Data for GIS users
For GIS users, we offer the following links to our ArcGIS services and shapefiles. The services are statewide data sets, while the shapefiles are specific to each quadrangle as indicated.
Footnote
The maps, reports, and GIS shapefiles related to this release can be downloaded any time from our Information Warehouse Regulatory Maps Portal. If you wish to look up a specific parcel or address, we recommend the California Earthquake Hazards Zone application ('EQ Zapp').
Official Maps for New Seismic Hazard Zones in Contra Costa and San Mateo Counties
September 23, 2021
(BELOW) Index maps showing locations of the Seismic Hazard Zone maps included in this release.
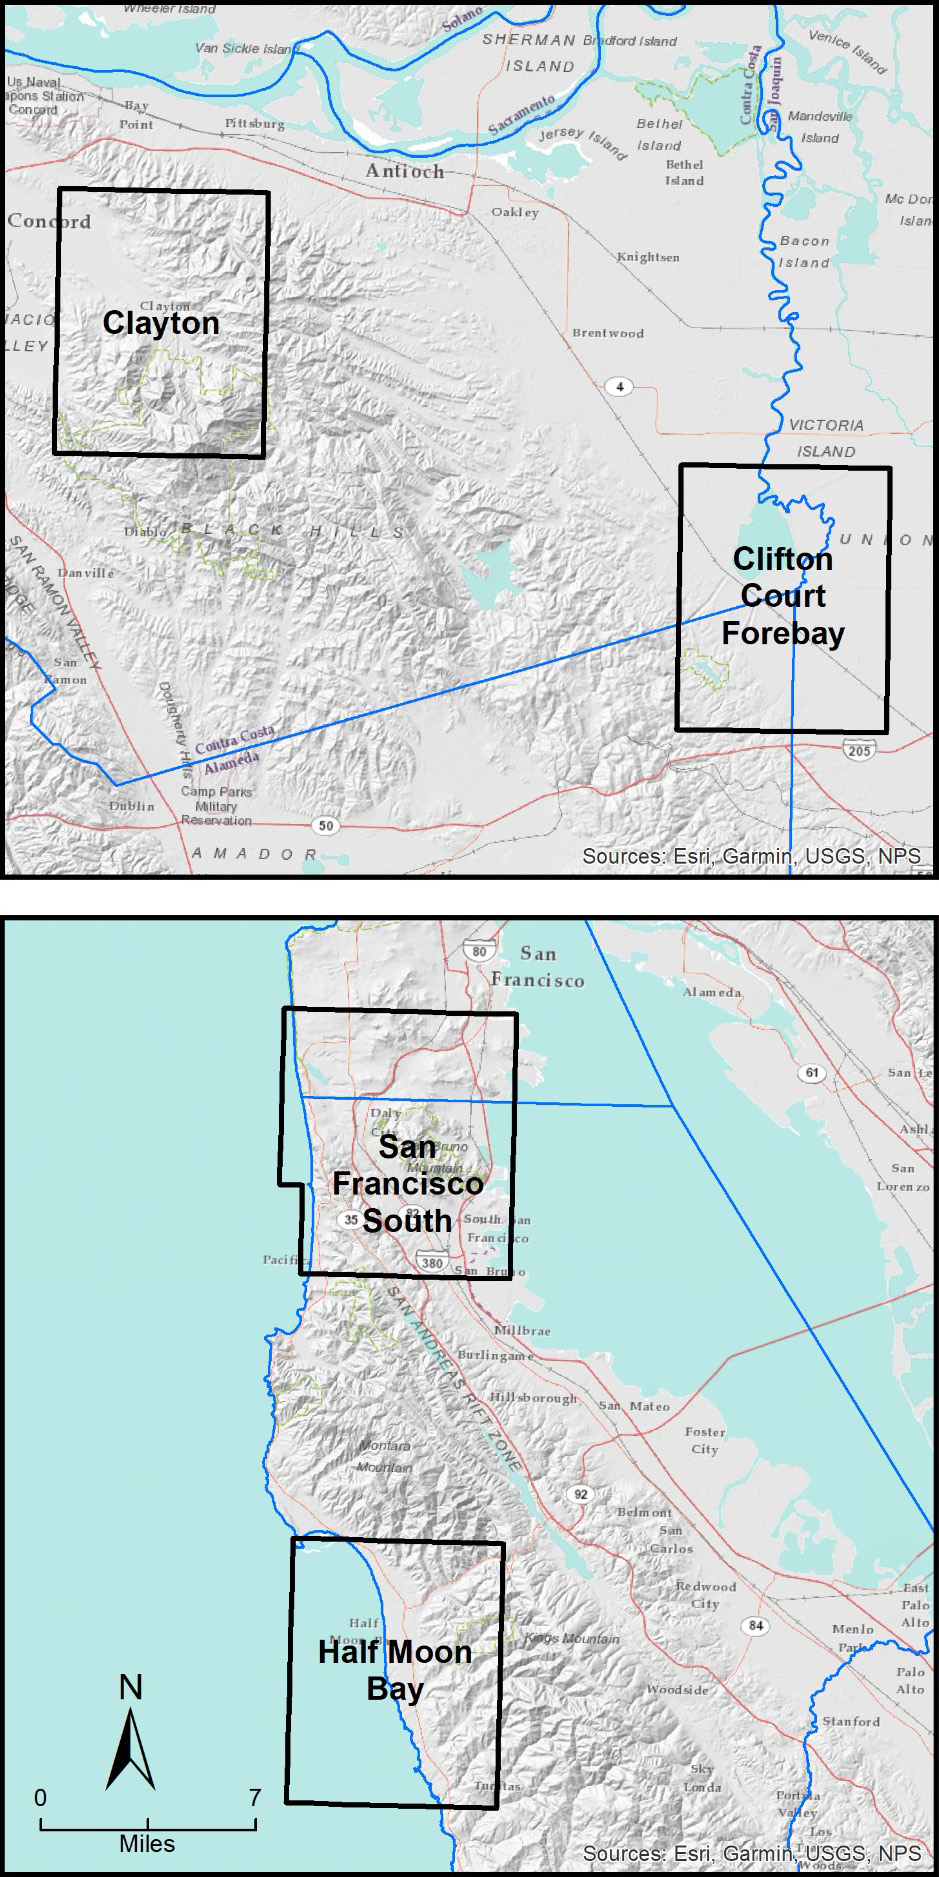
The California Geological Survey (CGS) released official maps and reports of new Seismic Hazard Zones to the cities of Brisbane, Clayton, Colma, Concord, Daly City, Half Moon Bay, Pacifica, Pittsburg, San Bruno, South San Francisco, and Walnut Creek, and the counties of Contra Costa and San Mateo.
These maps are released under the authority of the Seismic Hazards Mapping Act that was passed following the 1989 Loma Prieta earthquake. The Seismic Hazards Mapping Act is a state law designed to reduce the hazards from soil liquefaction and landslides during an earthquake.
Seismic Hazard Zones are regulatory zones that encompass areas that have a potential for future ground deformations caused by liquefaction or landslides.
The maps and reports are available as PDF files, which can be viewed using Adobe Acrobat Reader. To download these maps and reports, follow the links provided below.
Downloadable Files Related to this Release
Clayton and Clifton Court Forebay (Contra Costa County)
Half Moon Bay and San Francisco South (San Mateo County)
Reference Guide for Evaluating Seismic Hazards
Spatial Data for GIS users
For GIS users, we offer the following links to our ArcGIS services and shapefiles. The services are statewide data sets, while the shapefiles are specific to each quadrangle as indicated.
Footnote
The maps, reports, and GIS shapefiles related to this release can be downloaded any time from our Information Warehouse Regulatory Maps Portal. If you wish to look up a specific parcel or address, we recommend the California Earthquake Hazards Zone application ('EQ Zapp').
Special Report 255 - Mineral Land Classification of the Teichert Shifler Property, Yolo County, California, for Portland Cement Concrete Aggregate
June 9, 2021
by Greg Marquis
Background of Special Report 255
Teichert Materials submitted a petition dated September 30, 2020 to the SMGB for classification of the Shifler Property, located approximately three miles west of the town of Woodland in Yolo County, just south of Cache Creek. The property consists of two parcels totaling 442 acres. The project area comprises 277 acres. The project area was most recently classified in CGS Special Report (SR) 245 in 2018. Portions of the project area were classified in SR 245 as not having significant mineral resources based on an analysis of surficial geologic mapping. Under the provisions of the Surface Mining and Reclamation Act of 1975 (SMARA; Public Resources Code § 2712 et seq.), the petitioner requested that the State Geologist reclassify the project area as MRZ-2 for PCC aggregate.
Summary of Special Report 255
The State Geologist investigated the area proposed for mining, and subsequently reclassified it as Mineral Resource Zone 2 (MRZ-2) for Portland cement concrete (PCC) aggregate. The petition contains drill logs that show the presence of construction aggregate at mineable depths throughout the project area. The petition also references a third-party laboratory that concluded the project area aggregate was suitable for use in PCC based on petrographic analysis. In addition to evidence provided in the petition, adjacent properties—also located off-channel from Cache Creek—are being or have been mined for PCC aggregate. The value of the aggregate resource in the project area exceeds the threshold for a significant deposit of construction materials for the purpose of classification.
Special Report 252 - Update of the Mineral Land Classification for Concrete Aggregate Resources of Merced County, California
May 21, 2021
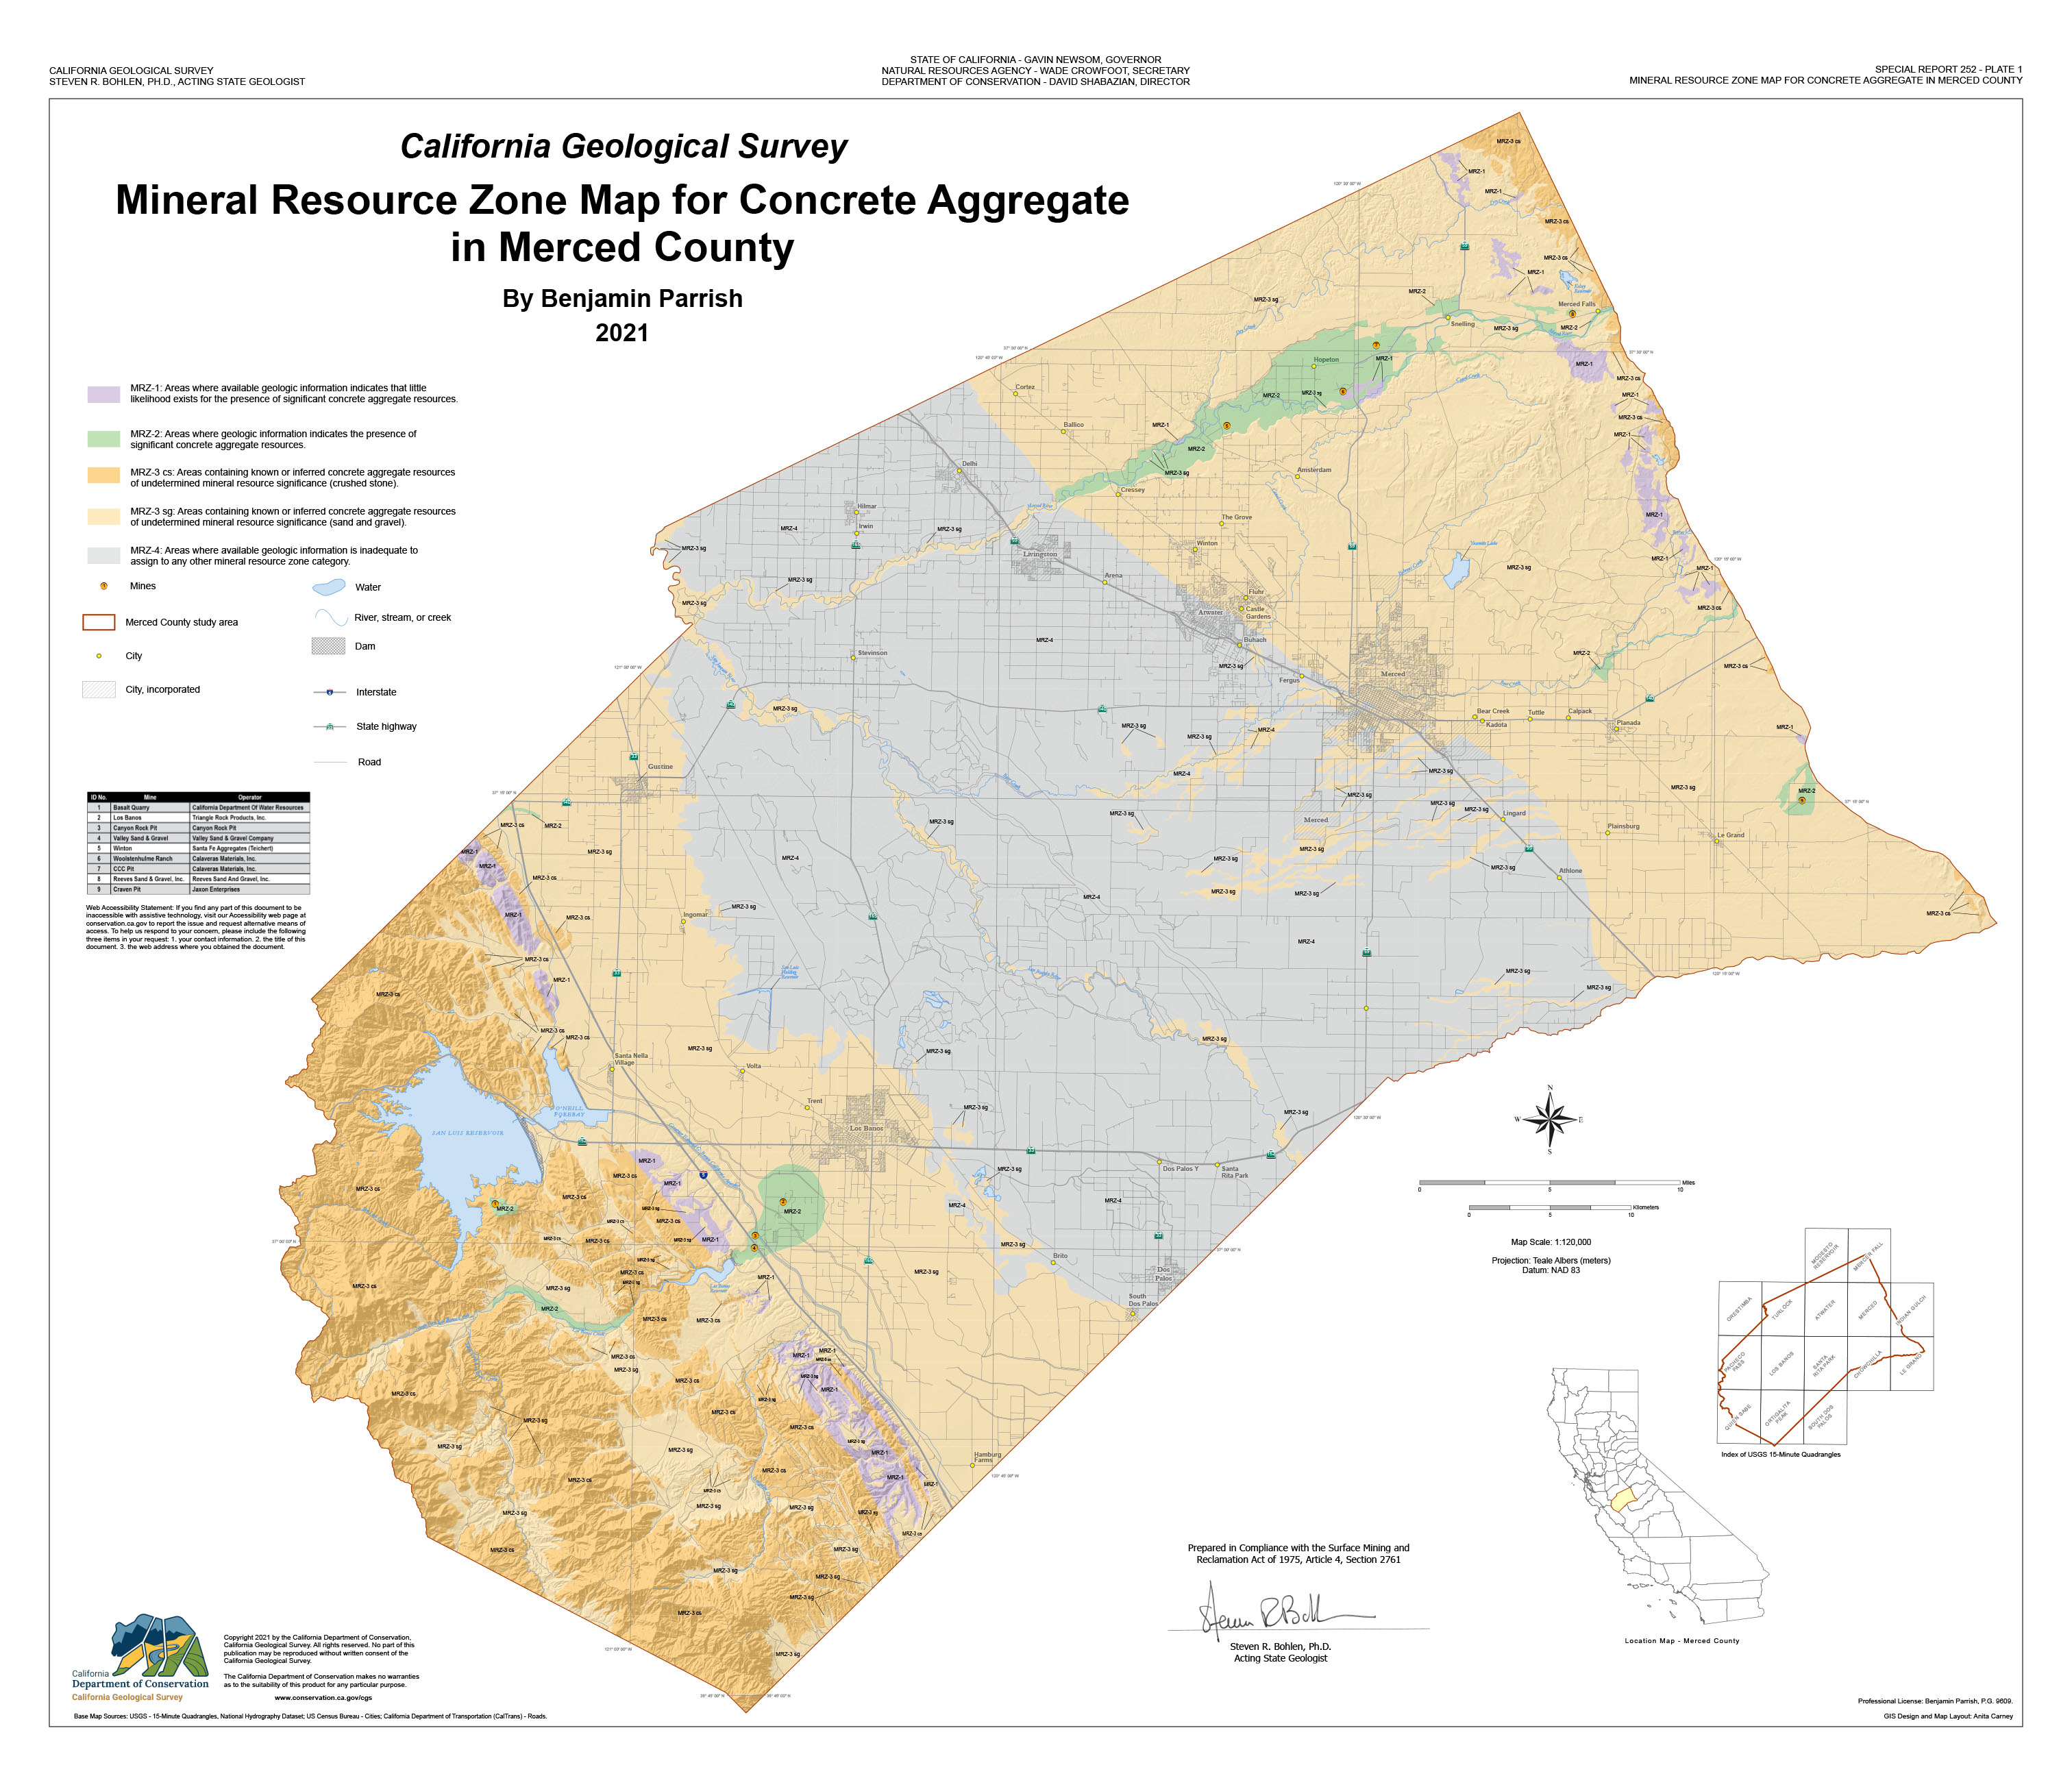 by Benjamin Parrish
Clicking the links above will take you to our File Request system, where you can request high-quality PDF versions of the documents. You will need to provide your email address, but other than that the process is quick, and you receive a file link within five minutes of requesting it.
Special Report 251 - Update of the Mineral Land Classification for Construction Aggregate Resources in the Monterey Bay Production-Consumption Region
May 21, 2021
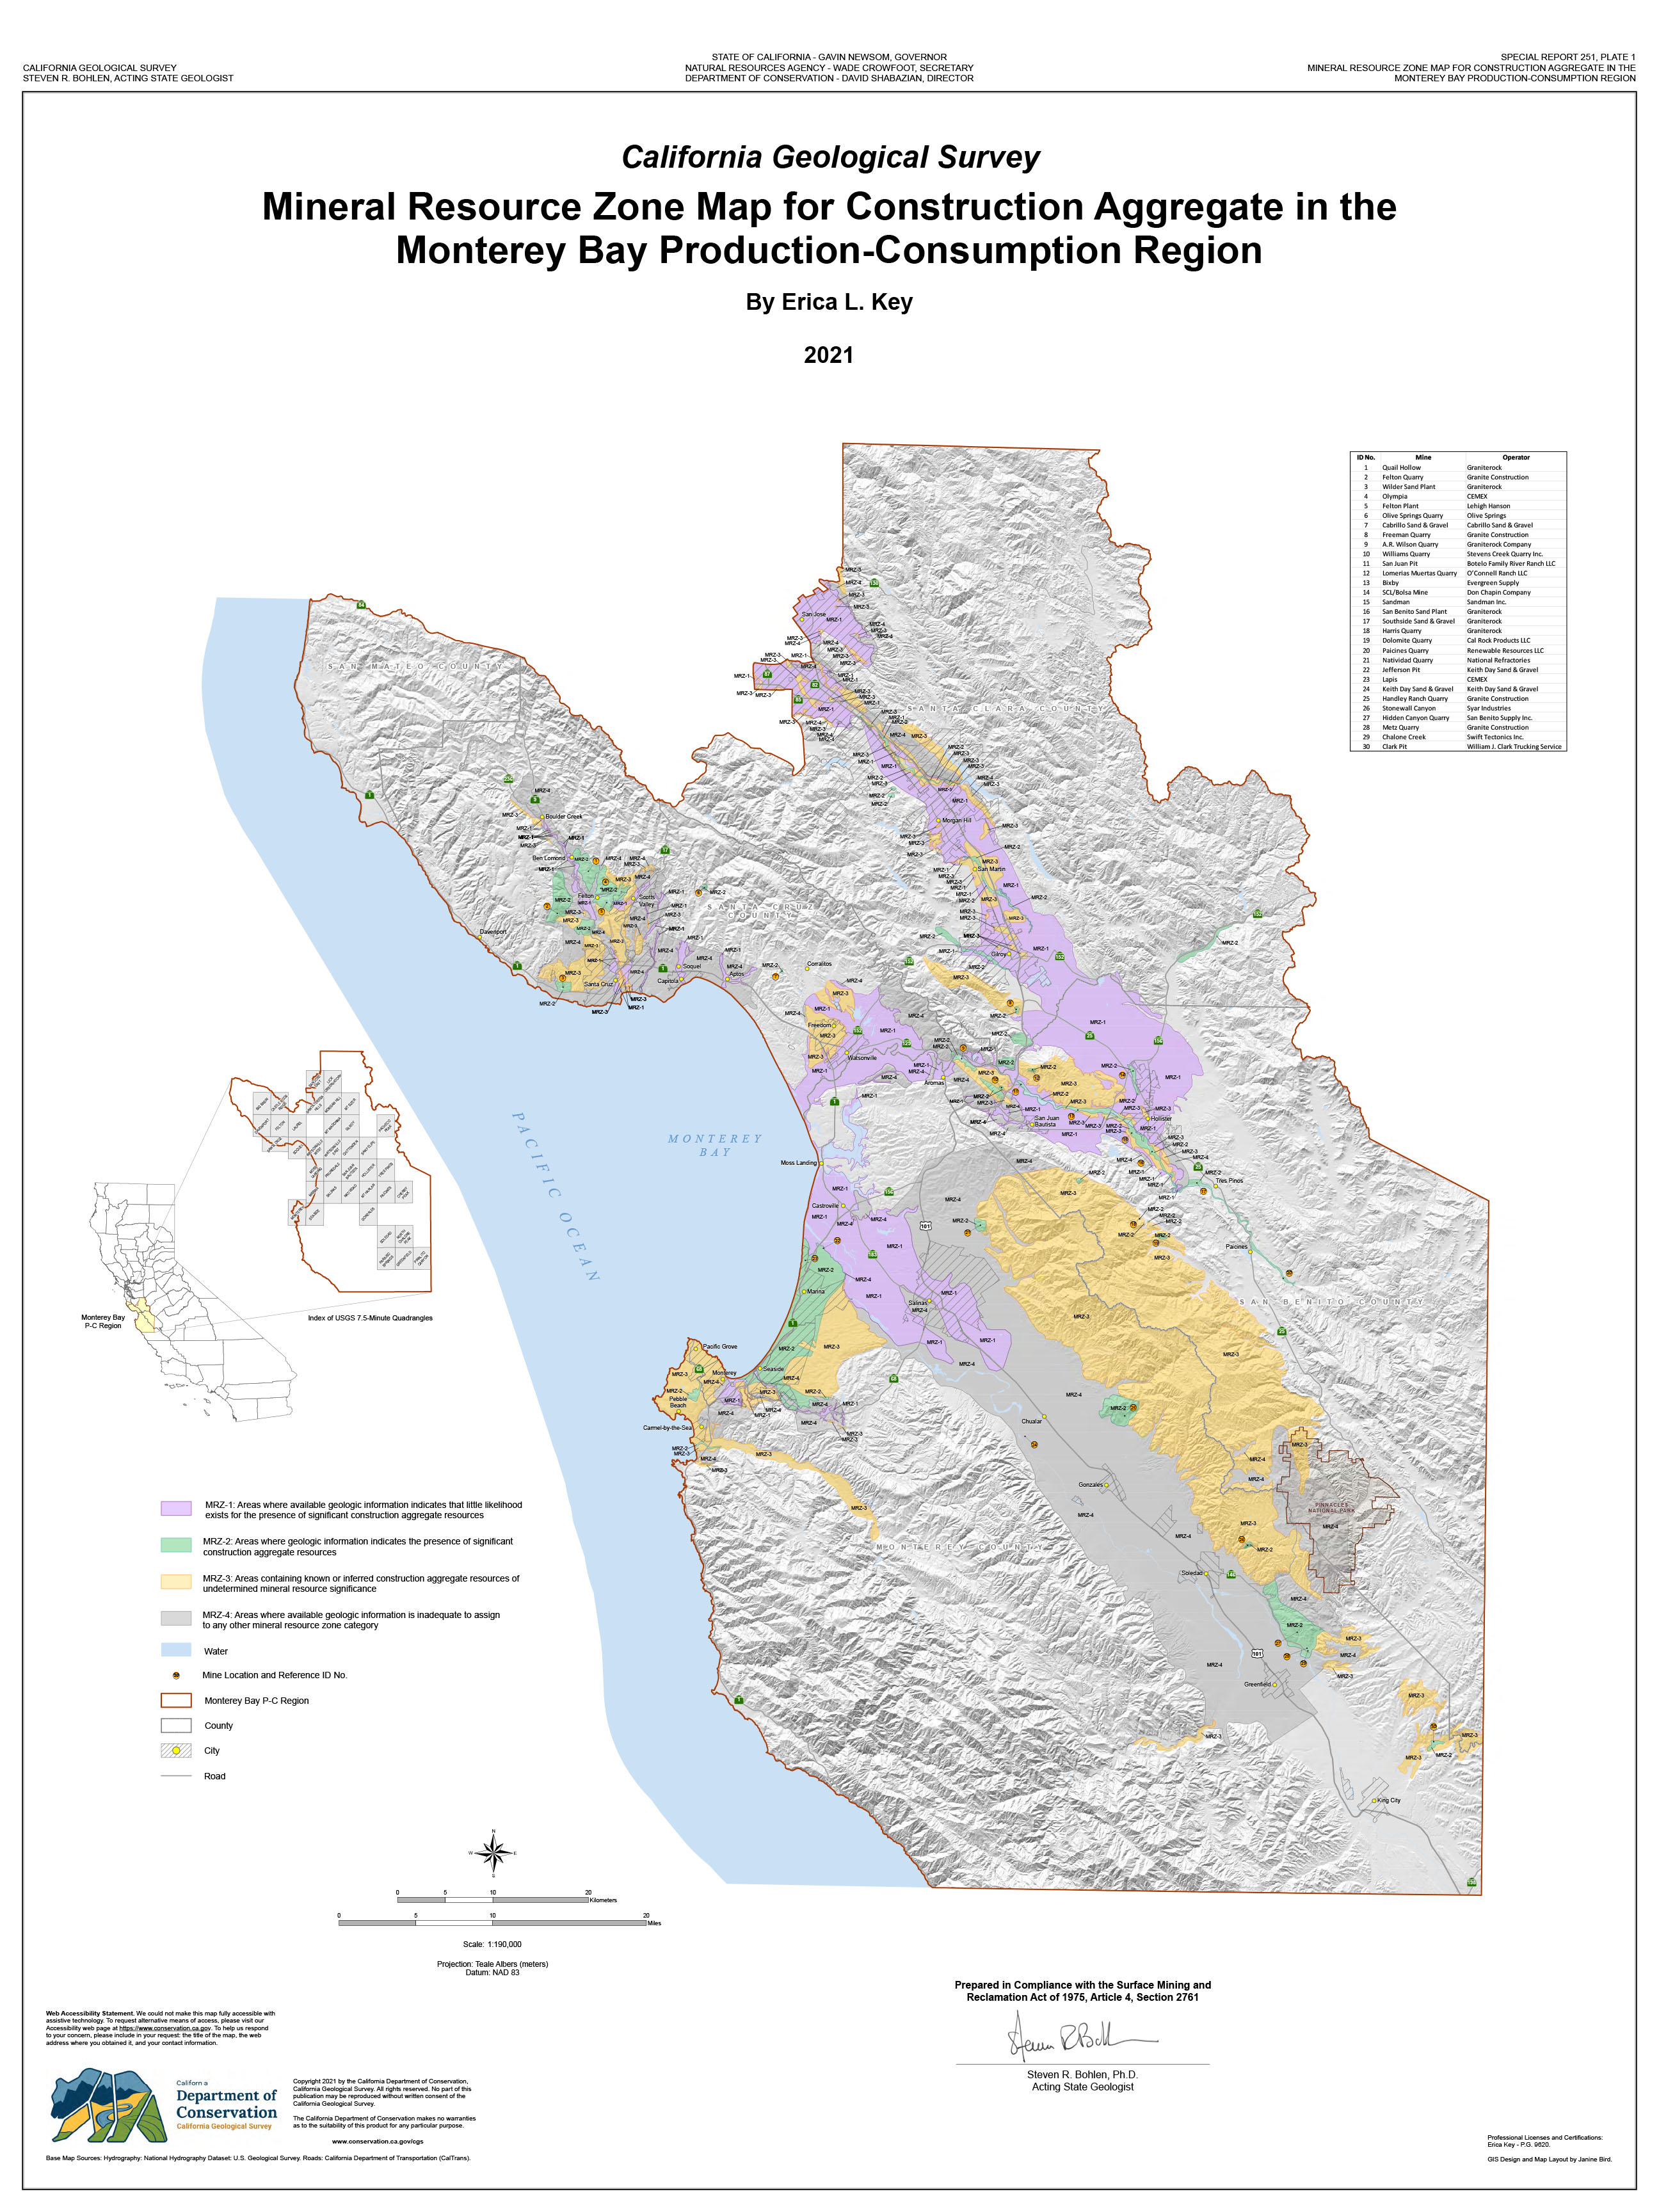 by Erica Key
Clicking the links above will take you to our File Request system, where you can request high-quality PDF versions of the documents. You will need to provide your email address, but other than that the process is quick, and you receive a file link within five minutes of requesting it.
Special Publication 126 - The California Geological Survey: A History of California’s State Geological Surveys, 1850-2015
August 17, 2020
 by Trinda L. Bedrossian
The Department of Conservation, California Geological Survey (DOC/CGS) announces the release of Special Publication 126, a history of work performed by California’s state geological surveys between 1850 and 2015. As one of the first and longest-operating agencies in the state, CGS has weathered more than 165 years of physical and political challenges, financial difficulties, changes in scientific advancement, and public scrutiny. From the sparsely populated Gold Rush days of the early 1850s through years of rapid population growth and development, CGS maintained its goal of providing the citizens of California with sound, unbiased scientific data and advice on the diverse geology of the state, its mineral resources, and its geologic hazards. Such information was used in local decision-making to better protect public health and safety, to improve building standards and codes, and to address the state’s growing environmental concerns. Between 1850 and 2015, there were 22 State Geologists/State Mineralogists and six name changes, some reflecting the changes in focus of CGS’s mandated activities.
In Special Publication 126, CGS activities are described under four general categories: The First Geological Surveys (1850-1880), The Mining Years (1880-1930), Mining and Geology (1930-1970), and Geologic Hazards and the Environment (1970-2015). These sections are organized by decade, as well as by the men who led the organization. The importance of the California Gold Rush, mineral resources, and early mining ventures were crucial to an understanding of assignments given to the first California geological surveys and during the mining years that followed. The shift of focus to mining and geology in the early 1900s reflected the need to better delineate topographic and geologic conditions to meet growth within California. During the late 1960s and early 1970s the focus on environmental hazards, public safety, and protection of the environment resulted in the licensing of geologists and geophysicists, and greater inclusion of geologic analyses and processes in both local and regional-scale land-use planning. Along with its legislative mandates, CGS remained a scientific advisory agency providing maps, published documents, geologic reviews, and advisory services to federal, state, and local agencies responsible for implementing laws and regulations involving geologic issues. In coordination with other emergency response agencies, CGS also developed measures for responding to natural geologic events in the state. Today, CGS continues to provide the Governor, State Legislature, other governmental agencies, and countless others with information on mineral resources and geologic hazards associated with earthquakes, liquefaction, landslides, erosion, alluvial fan flooding, volcanism, tsunamis, and hazardous minerals.
Special Publication 126 is available as a hard copy for $75, plus $8 to cover shipping. It is not available for download. To purchase the book, contact our
Publications Sales Desk.
Special Report 246 - Radon Potential in Western Placer County, California
June 1, 2020
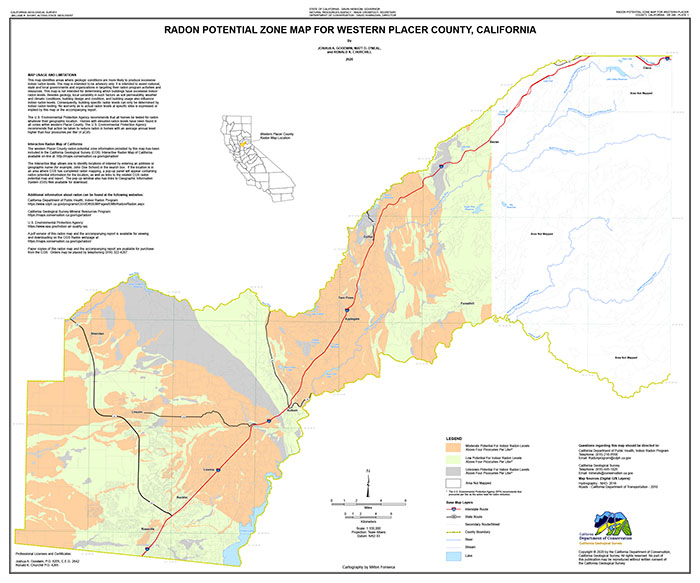 by Joshua A. Goodwin, Matt D. O’Neal, and Ronald K. Churchill
Background of Special Report 246
Radon is a naturally occurring odorless and colorless radioactive gas. It forms from the radioactive decay of small amounts of uranium naturally present in rocks and soils. Given the right circumstances, radon can move from the subsurface and concentrate in overlying homes and buildings. Breathing air with elevated radon gas increases one’s risk of developing lung cancer. While not everyone exposed to radon will develop lung cancer, the U.S. Environmental Protection Agency (U.S. EPA) estimates that 21,000 people in the United States die annually from lung cancer attributed to radon exposure. Indoor-radon concentrations are related to the uranium contents of local soils and rocks, soil permeability, climate, and building design, condition, and usage. Uranium data for rocks and soils provide information on where radon concentrations in the subsurface are higher or lower. Soil permeability data provide information on pathway availability for radon to move from the subsurface to a building’s foundation. Indoor-radon data represent the combined result of these factors at a specific location and can be used to develop radon potential maps. Radon potential maps identify areas where homes and other buildings are more likely, or less likely, to exceed the U.S. EPA’s recommended radon action level of 4 picocuries per liter (4 pCi/L). Radon potential maps may be used with population data to estimate the number of individuals exposed to 4 pCi/L or higher radon levels within the area of map coverage. In California, radon potential maps are informational, not regulatory.
Summary of Special Report 246
The Department of Conservation, California Geological Survey (CGS) has completed a radon potential map and report for Western Placer County, California. The map identifies areas more likely, and areas less likely, to have indoor-radon measurements exceeding the U.S. EPA recommended action level of 4 pCi/L. The map also identifies areas where more data are needed to determine the radon potential. All radon potential areas, high, moderate, or low, contain some indoor-radon measurements above the U.S. EPA recommended action level and some below. This map cannot be used for determining the indoor-radon level of a particular building. Testing for radon is the only way to determine a building’s radon level, no matter where it is located. The Western Placer County radon potential map was developed using indoor-radon test data, geologic unit information from several geologic maps, uranium geochemistry data, and soil permeability data. Details about these data and maps, and the procedures used to develop the radon potential map, are included in the accompanying report. The report also estimates the number of Western Placer County residents potentially exposed to indoor-radon levels at or above the U.S. EPA recommended action level.
Availability of Special Report 246
Special Report 246 and its associated plate (map) are available as free downloads or as printed products; there is a charge for the printed version. (NOTE: Plate 1 measures 36 inches by 30 inches.) To purchase printed copies, contact our
Publications Sales Desk or visit the California Geological Survey Library in Sacramento.
Special Report 244 - Radon Potential in Western Santa Clara County, California
June 1, 2020
 by Ronald K. Churchill
Background of Special Report 244
Radon is a naturally occurring odorless and colorless radioactive gas. It forms from the radioactive decay of small amounts of uranium naturally present in rocks and soils. Given the right circumstances, radon can move from the subsurface and concentrate in overlying homes and buildings. Breathing air with elevated radon gas increases one’s risk of developing lung cancer. While not everyone exposed to radon will develop lung cancer, the U.S. Environmental Protection Agency (U.S. EPA) estimates that 21,000 people in the United States die annually from lung cancer attributed to radon exposure. Indoor-radon concentrations are related to the uranium contents of local soils and rocks, soil permeability, climate, and building design, condition, and usage. Uranium data for rocks and soils provide information on where radon concentrations in the subsurface are higher or lower. Soil permeability data provide information on pathway availability for radon to move from the subsurface to a building’s foundation. Indoor-radon data represent the combined result of these factors at a specific location and can be used to develop radon potential maps. Radon potential maps identify areas where homes and other buildings are more likely, or less likely, to exceed the U.S. EPA’s recommended radon action level of 4 picocuries per liter (4 pCi/L). Radon potential maps may be used with population data to estimate the number of individuals exposed to 4 pCi/L or higher radon levels within the area of map coverage. In California, radon potential maps are informational, not regulatory.
Summary of Special Report 244
The Department of Conservation, California Geological Survey (CGS) has completed a radon potential map and report for Western Santa Clara County, California. The map identifies areas more likely, and areas less likely, to have indoor-radon measurements exceeding the U.S. EPA recommended action level of 4 pCi/L. The map also identifies areas where more data are needed to determine the radon potential. All radon potential areas, high, moderate, or low, contain some indoor-radon measurements above the U.S. EPA recommended action level and some below. This map cannot be used for determining the indoor-radon level of a particular building. Testing for radon is the only way to determine a building’s radon level, no matter where it is located. The Western Santa Clara County radon potential map was developed using indoor-radon test data, geologic unit information from several geologic maps, uranium geochemistry data, and soil permeability data. Details about these data and maps, and the procedures used to develop the radon potential map, are included in the accompanying report. The report also estimates the number of Western Santa Clara County residents potentially exposed to indoor-radon levels at or above the U.S. EPA recommended action level.
Availability of Special Report 244
Special Report 244 and its associated plate (map) are available as free downloads or as printed products; prints are $52 each, plus $8 to cover shipping. (NOTE: Plate 1 measures 38 inches by 36 inches.) To purchase printed copies, contact our
Publications Sales Desk or visit the California Geological Survey Library in Sacramento.
Special Report 242 - Radon Potential in Amador, Calaveras, and Tuolumne Counties, California
April 2, 2020
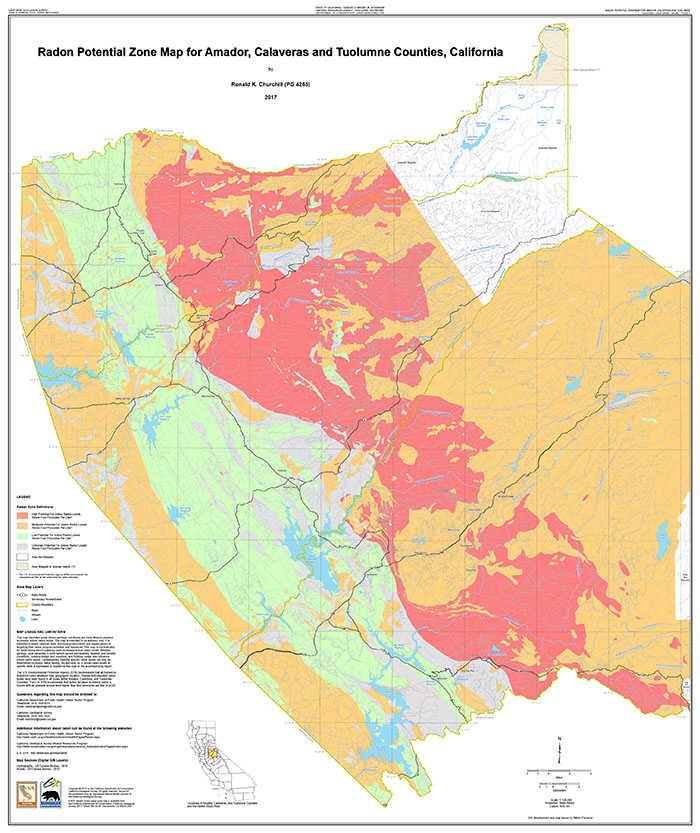 by Ronald K. Churchill
Background of Special Report 242
Radon is a naturally occurring odorless and colorless radioactive gas. It forms from the radioactive decay of small amounts of uranium naturally present in rocks and soils. Given the right circumstances, radon can move from the subsurface and concentrate in overlying homes and buildings. Breathing air with elevated radon gas increases one’s risk of developing lung cancer. While not everyone exposed to radon will develop lung cancer, the U.S. Environmental Protection Agency (U.S. EPA) estimates that 21,000 people in the United States die annually from lung cancer attributed to radon exposure. Indoor-radon concentrations are related to the uranium contents of local soils and rocks, soil permeability, climate, and building design, condition, and usage. Uranium data for rocks and soils provide information on where radon concentrations in the subsurface are higher or lower. Soil permeability data provide information on pathway availability for radon to move from the subsurface to a building’s foundation. Indoor-radon data represent the combined result of these factors at a specific location and can be used to develop radon potential maps. Radon potential maps identify areas where homes and other buildings are more likely, or less likely, to exceed the U.S. EPA’s recommended radon action level of 4 picocuries per liter (4 pCi/L). Radon potential maps may be used with population data to estimate the number of individuals exposed to 4 pCi/L or higher radon levels within the area of map coverage. In California, radon potential maps are informational, not regulatory.
Summary of Special Report 242
The Department of Conservation, California Geological Survey (CGS) has completed a radon potential map and report for Amador, Calaveras, and Tuolumne Counties, California. The map identifies areas more likely, and areas less likely, to have indoor-radon measurements exceeding the U.S. EPA recommended action level of 4 pCi/L. The map also identifies areas where more data are needed to determine the radon potential. All radon potential areas, high, moderate, or low, contain some indoor-radon measurements above the U.S. EPA recommended action level and some below. This map cannot be used for determining the indoor-radon level of a particular building. Testing for radon is the only way to determine a building’s radon level, no matter where it is located. The Amador, Calaveras, and Tuolumne Counties radon potential map was developed using indoor-radon test data, geologic unit information from several geologic maps, uranium geochemistry data, and soil permeability data. Details about these data and maps, and the procedures used to develop the radon potential map, are included in the accompanying report. The report also estimates the number of Amador, Calaveras, and Tuolumne County residents potentially exposed to indoor-radon levels at or above the U.S. EPA recommended action level.
Availability of Special Report 242
Special Report 242 and its associated plate (map) are available as free downloads or as printed products; prints are $35 each, plus $8 to cover shipping. (NOTE: Plate 1 measures 42 inches by 50 inches.) To purchase printed copies, contact our
Publications Sales Desk or visit the California Geological Survey Library in Sacramento.
California Reported Landslides Database and Map
July 1, 2019
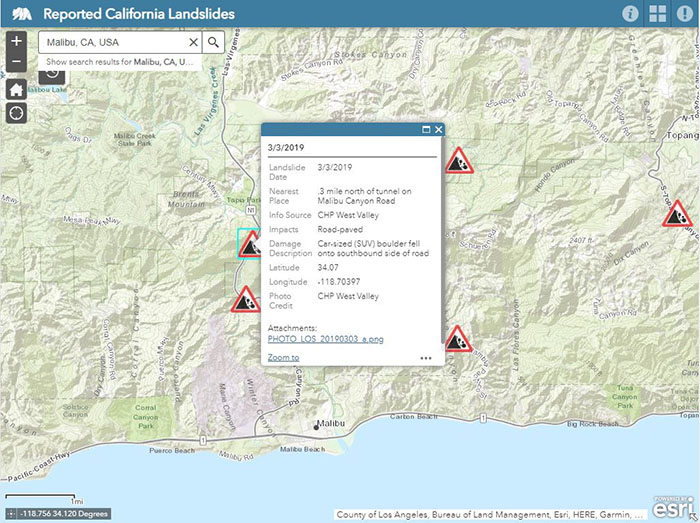 by W. Paul Burgess, Rachel A. Beard, Robert A. Wurgler, and Jeremy T. Lancaster
The nascent California "Reported Landslides" database compiled by the California Geological Survey (CGS) is a repository for the collection and communication of recent statewide landslide data. The repository is presented to the public as an online interactive ArcGIS Online map displaying landslide locations and other attributes to show varying scales of landslide processes affecting California's citizens, businesses, and infrastructure.
Landslide events are communicated with seven attribute fields including Landslide Date, Nearest Place, Info Source, Impacts, Damage Description, Latitude, and Longitude, and include (if available) a representative photograph to increase the educational impact of the landslide processes attributed to each event.
With the continued development of this database, the CGS endeavors to reach Californians and California governmental agencies with data useful for education and planning purposes. The development of the "Reported Landslides" database is considered vital to better describing the causes of storm-induced landslides. It is the aim of the CGS to eventually implement the database as a tool to provide statistical insights into frequency of given landslide types.
 Explore the California Reported Landslides Map
Special Report 245 - Mineral Land Classification: Concrete Aggregate in the Greater Sacramento Area Production-Consumption Region (2018)
June 3, 2019
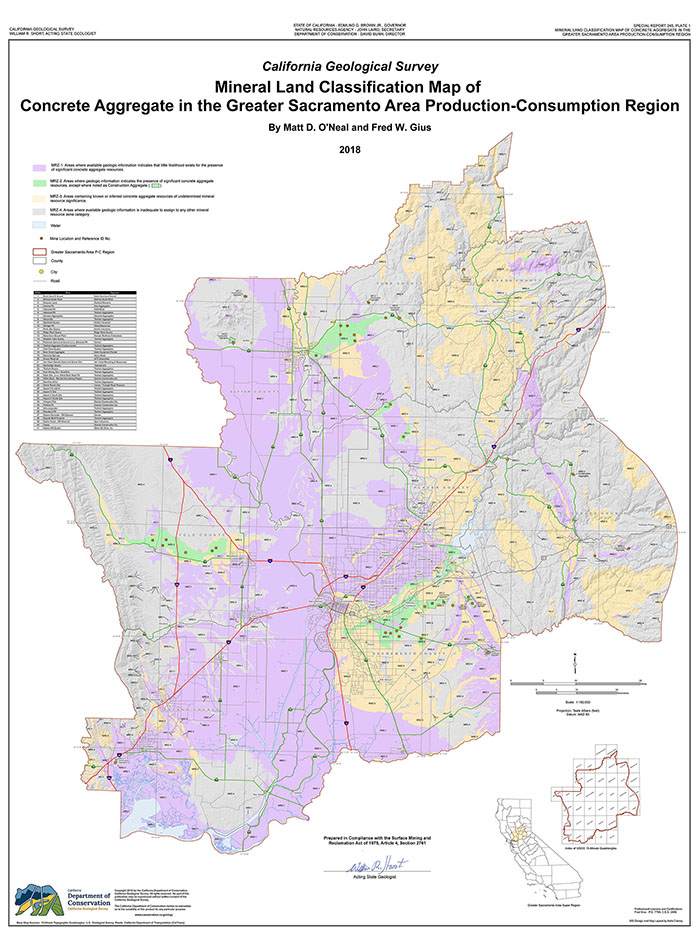 by Matt D. O'Neal and Fred W. Gius
Background of Special Report 245
California's Surface Mining and Reclamation Act of 1975 (SMARA) requires the State Geologist to classify land into Mineral Resource Zones (MRZs), based on the known or inferred mineral resource potential of that land. The process is based solely on geology, without regard to existing land use or land ownership. The primary goal of mineral land classification (MLC) is to help ensure, through appropriate local lead agency policies and procedures, that mineral resources will be available when needed and do not become inaccessible because of inadequate information during the land-use decision‑making process.
Summary of Special Report 245
This report is the first MLC study of concrete aggregate resources to cover all lands within the newly defined Greater Sacramento Area Production-Consumption (P-C) Region. The region is 6,080 square miles in area, of which 2,580 square miles were classified for a variety of mineral commodities for different purposes between 1975 and 2010. The remaining 3,500 square miles of the P-C Region are newly classified for concrete aggregate resources in the present report.
Urban expansion in the P-C Region threatens to preclude mineral resource extraction. At present, the P-C Region contains sufficient concrete aggregate resources to meet the projected 50-year demand. However, there is a substantial and important disparity between the geographic distribution of mineral resources and population centers. Only a minor proportion of resources are located near population centers. Utilization of more distant resources results in a significant increase in cost to the aggregate consumer, road wear and tear, traffic congestion, greenhouse gas emissions, and air pollution. For example, each additional mile of aggregate transport costs 15 cents per ton, and one mile of a six-lane highway consumes more than 110,000 tons of aggregate.
In this update report, the following conclusions are reached:
- The 10 historic reports identified 85 concrete aggregate resource sectors, with a total area of 42,033 acres (66 square miles).
- Of this area, 2,417 acres (about 6 percent) have become lost due to changing land use, resource depletion, or re-evaluation based on new data.
- The remaining 39,616 acres host a total of 3,565 million tons of concrete aggregate resources.
- This report identifies an additional nine concrete aggregate resource sectors with a total area of 3,880 acres.
- These newly identified sectors host a total of 769 million tons of concrete aggregate resources.
- An estimated 4,334 million tons of resources are identified in the P-C Region.
- The projected demand of construction aggregate in the P-C Region for the next 50 years (through the year 2066) is 1,367 million tons. Of this total, 889 million tons will likely be used for concrete aggregate.
- The 1,446 million tons of currently permitted concrete aggregate reserves are projected to last beyond the year 2066.
- Presently, the P-C Region consumes approximately as much as it produces, with imports and exports estimated to account for less than 5% of consumption and production within the region.
- Land-use planners and decision-makers in the P-C Region are faced with balancing a wide variety of needs in planning for a sustainable future for their communities. These include the need to plan carefully for the use of lands containing construction aggregate resources, to consider the permitting of additional aggregate resources in the P-C Region, and to take into consideration the demands of neighboring areas, within the P-C Region, that are competing for resources.
Availability of Special Report 245
Special Report 245 and its associated plates (maps) are available as free downloads or as printed products. (NOTE: The plates measure 36 inches by 48 inches each.) To purchase printed copies, contact our
Publications Sales Desk or visit the California Geological Survey Library in Sacramento.
Special Report 243 - Landslide Hazard Mapping for Selected California Highway Corridors, Phase 2
April 30, 2019
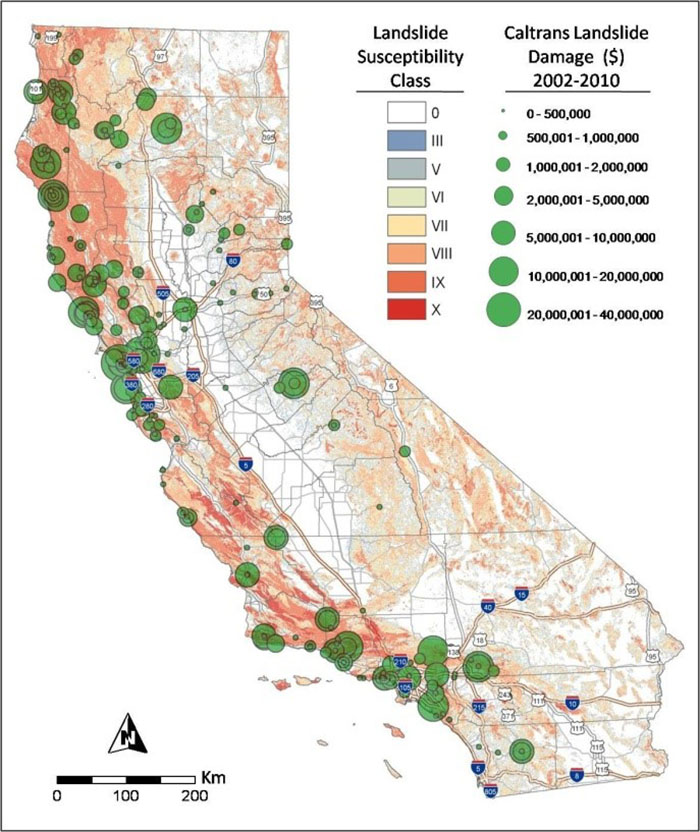 by C.J. Wills, W.D. Haydon, B.J. Swanson, F.G. Perez, C.I. Gutierrez, and J.T. Lancaster
Caltrans has responsibility for over 1600 miles of landslide-prone highway corridors throughout California. The potential for landslide damage to highways in California is concentrated in areas where several aspects of the geology and geography converge to make landslide movement more likely. Landslide inventory maps are a key step supporting an analysis of the potential risks to highways from landslides.
This Phase 2 report extends Phase 1 work completed in 2006 and adds roughly 277 miles of landslide mapping, bringing the total for the Caltrans Highway Corridor Landslide Mapping project to 465 miles. Each highway corridor is divided into sections based on similarities in the bedrock geology, slopes, and size, type, and activity of landslides. The chapters summarize where a combination of factors lead to increased potential for landslides and provide information on the potential consequences to the roadway if a landside were to reactivate. These maps and descriptions of the factors leading to areas of high landslide potential will assist Caltrans in planning for long term landslide hazard mitigation and support slide-aware maintenance practices along these highway corridors.
This study was funded by the Caltrans Division of Research, Innovation and System Information. Cliff Roblee provided contract management and detailed product peer review as well as coordination with Caltrans geo-professionals through a project panel.
CGS Special Report 243 and its collection of forty-five plates (oversize maps) are available as free downloads from our
Highway Corridor Landslide Hazard Mapping page. We are not offering printed copies due to the prohibitive cost of production.
Official Maps for New Seismic Hazard Zones in Contra Costa and San Mateo Counties
April 4, 2019
On April 4, 2019, the California Geological Survey (CGS) released five official maps of Seismic Hazard Zones affecting the cities of Antioch, Belmont, Brentwood, Burlingame, Concord, Half Moon Bay, Hillsborough, Millbrae, Oakley, Pacifica, Pittsburg, Redwood City, San Bruno, San Carlos, the towns of Portola Valley and Woodside, and the counties of Contra Costa and San Mateo. These maps were released under the authority of the Seismic Hazards Mapping Act that was passed following the 1989 Loma Prieta earthquake. The Seismic Hazards Mapping Act is a state law designed to reduce the hazards from soil liquefaction and landslides during an earthquake.
Seismic Hazard Zones are regulatory zones identifying areas that have a potential for future ground deformations caused by liquefaction or earthquake-induced landslides.
List of Official Maps and Reports released April 4, 2019
-
Antioch North quadrangle, showing Seismic Hazard Zones only
- Related: Seismic Hazard Zone Report 125
-
Antioch South quadrangle, showing Seismic Hazard Zones only
- Related: Seismic Hazard Zone Report 126
-
Honker Bay quadrangle, showing Seismic Hazard Zones only
- Related: Seismic Hazard Zone Report 127
-
Montara Mountain quadrangle, showing Earthquake Fault Zones and Seismic Hazard Zones
- Related: Seismic Hazard Zone Report 128
-
Woodside quadrangle, showing Earthquake Fault Zones and Seismic Hazard Zones
- Related: Seismic Hazard Zone Report 129
The maps are available as GeoPDF files, which can be viewed using Adobe Acrobat Reader; a GeoPDF file consists of multiple layers and gives the user greater flexibility in viewing and displaying the maps. The maps are also available as digital Geographic Information System (GIS) files. GIS files for both AP Earthquake Fault Zones and Seismic Hazard Zones released by CGS are considered Official Maps.
To obtain these maps, reports and GIS data, visit the
Regulatory Maps and Reports section of the CGS Information Warehouse. To view individual parcels affected by Seismic Hazard Zones and/or Earthquake Fault Zones, visit our
Earthquake Hazards Zone Application ("EQ Zapp").
The index maps below show the general areas in Contra Costa and San Mateo counties affected by this release.
Map Sheet 65 and Map Sheet 66 - Landslides, Geomorphology, and Geology of the Iaqua Buttes and Owl Creek 7.5’ Quadrangles, Humboldt County, California
July 6, 2018
by James N. Falls, Gerald J. Marshall, Don R. Braun, and Shannon M.B. Utley
These are the first two maps in a series of adjacent geologic maps that will include Owl Creek, Iaqua Buttes, Mad River Buttes, and Yager Junction. The maps are available as free PDF downloads.
Iaqua Buttes Quadrangle (Map Sheet 65)
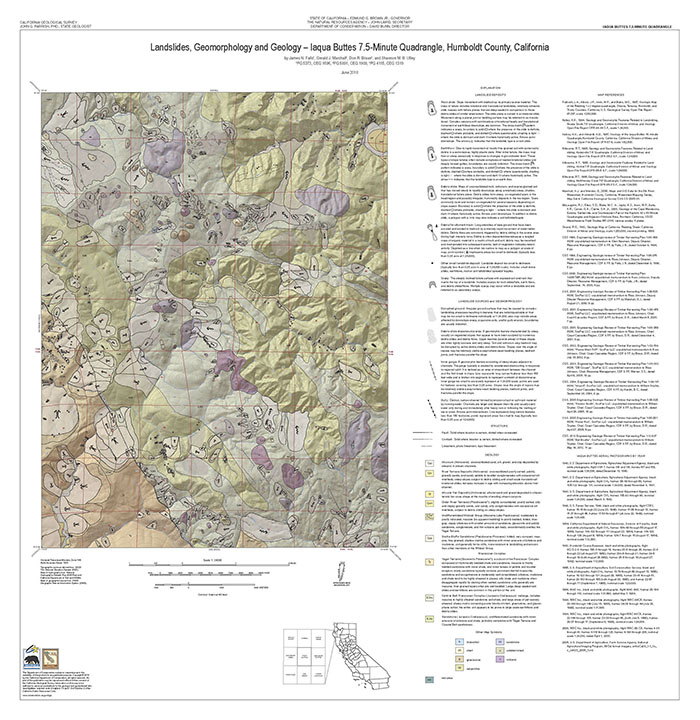 The Iaqua Buttes Quadrangle straddles the boundary of the Coastal and Central Belt of the Franciscan complex, and is underlain by two distinct northwest trending fault-bounded packages of sedimentary rocks. From west to east, rhythmically interbedded and sheared Eocene- to Paleocene(?)-aged sediments of the Yager Terrane (Coastal Belt) are faulted against Paleogene- to late Cretaceous-aged tectonic mélange of the Central Belt along the Freshwater Fault. The Freshwater fault is related to initial emplacement of Franciscan complex rocks along the western edge of North America and shows evidence of early Quaternary movement.
Owl Creek Quadrangle (Map Sheet 66)
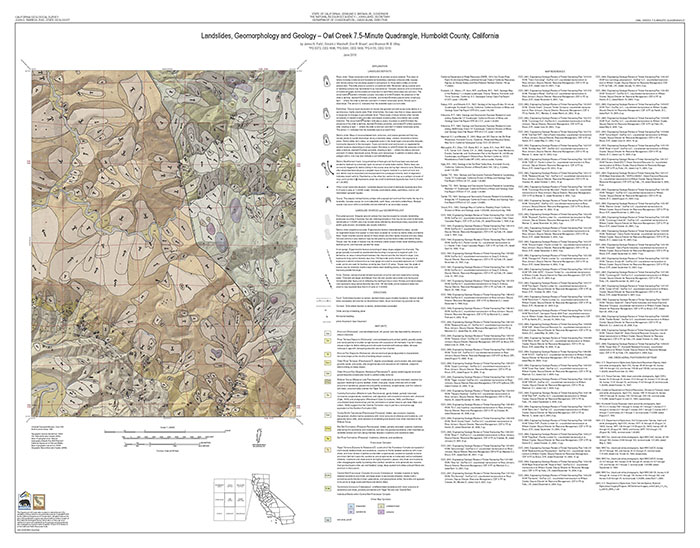 The Owl Creek Quadrangle straddles the boundary of the Coastal and Central Belt portions of the Franciscan complex, and is underlain by three distinct northwest trending fault-bounded packages of sedimentary rocks. From west to east, late Pleistocene- to Miocene-aged marine and non-marine overlap deposits of the Wildcat Group are faulted against rhythmically interbedded Eocene- to Paleocene(?)-aged sediments of the Yager Terrane (Coastal Belt) along the Little Salmon fault. The Yager Terrane rocks are faulted against Paleogene- to late Cretaceous- aged tectonic mélange of the Central Belt along the Freshwater Fault. The faults are related to initial emplacement of Franciscan complex rocks along the western edge of North America, and more recent faulting related to northwest migration of the Mendocino Triple Junction. Age of faulting within the Owl Creek Quadrangle may be late Quaternary, however, faulting on the Little Salmon fault northwest in the adjacent Hydesville Quadrangle is considered Holocene based on relatively fresh scarps and topographic lineaments observed in recent alluvium.
Special Report 240 - 2017 Update of Mineral Land Classification: Portland Cement Concrete-Grade Aggregate in the Western San Diego County Production-Consumption Region of California
February 16, 2018
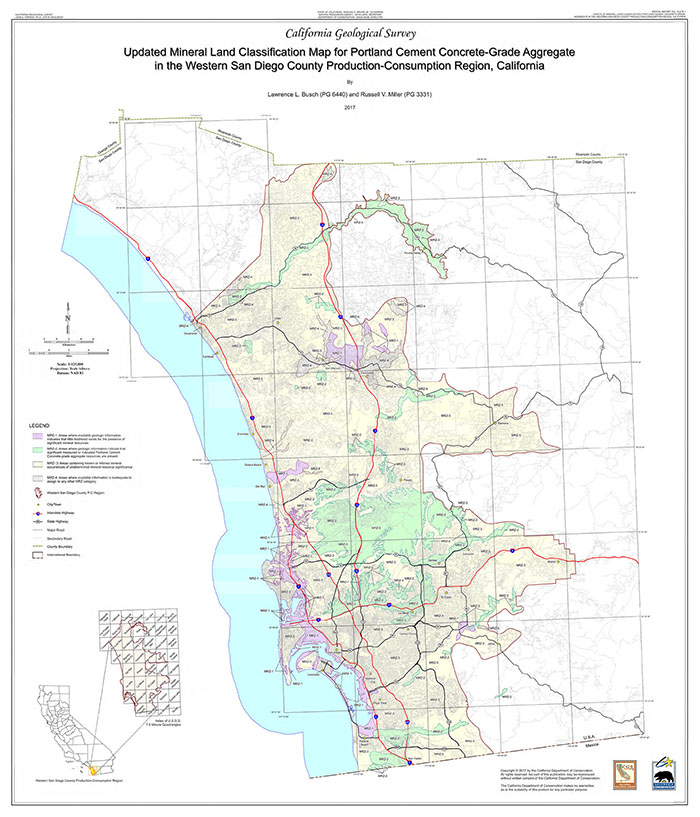 by Fred W. Gius, Lawrence L. Busch, and Russell V. Miller.
This report updates the mineral land classification of western San Diego County, reevaluates the region's PCC-grade aggregate resources, and includes an updated 50‑year projection of construction aggregate demand for the P-C Region through the year 2065.
Background of Special Report 240
California’s Surface Mining and Reclamation Act of 1975 (SMARA) requires the State Geologist to classify land into Mineral Resource Zones (MRZs), based on the known or inferred mineral resource potential of that land. The process is based solely on geology, without regard to existing land use or land ownership. The primary goal of mineral land classification is to help ensure, through appropriate local lead agency policies and procedures, that mineral resources will be available when needed and do not become inaccessible because of inadequate information during the land-use decision-making process.
Summary of Special Report 240
This report is the third in a series of regional mineral land classification reports for portland cement concrete (PCC)-grade aggregate for the Western San Diego County Production-Consumption Region (P-C Region). The original mineral land classification was published as Special Report (SR) 153 in 1982. The first update was published in 1996 as Open-File Report (OFR) 96-04. This current report updates the mineral land classification of the region, reevaluates the region’s PCC-grade aggregate resources, and includes an updated 50-year projection of construction aggregate demand for the P-C Region through the year 2065. This update report reevaluated the PCC-grade aggregate resources in areas originally designated by the State Mining and Geology Board and new areas identified in subsequent mineral land classification reports including this update report. This update report does not replace SR 153 or OFR 96-04.
Since the mid-1990s, local aggregate production has not been sufficient to meet local demand in the P-C Region. This shortfall has been met by importing construction aggregate, predominately sand, from neighboring aggregate producing regions. At various times, construction aggregate has been imported into the P-C Region from mines in Los Angeles, San Bernardino, Riverside, and Imperial counties, and Baja California, Mexico.
In this update report, the following conclusions are reached:
- Since the designation of 50,982 acres in 1985, 14,436 acres have been lost to urbanization or other incompatible land uses. The remaining 36,546 acres contain 5,700 million tons of PCC-grade aggregate resources.
- This update report identifies an additional 1,461 acres of undesignated land containing an estimated 282 million tons of PCC-grade aggregate resources.
- An estimated 5,982 million tons of PCC-grade aggregate resources, both designated and non-designated, are identified in the P-C Region.
- The projected demand of construction aggregate in the P-C Region for the next 50 years (through the year 2065) is estimated to be 760 million tons. Of this total, 380 million tons will likely be used for PCC.
- The 271 million tons of currently permitted PCC-grade aggregate reserves are projected to last to the year 2035.
- Presently, the P-C Region consumes more PCC-grade aggregate than it produces; the balance of the Region’s demand is imported from adjacent regions.
- Land-use planners and decision-makers in the P-C Region are faced with balancing a wide variety of needs in planning for a sustainable future for their communities. These include the need to plan carefully for the use of lands containing construction aggregate resources, to consider the permitting of additional aggregate resources in the P-C Region, and to take into consideration the demands of neighboring regions that are competing for the resources being imported into the San Diego area.
Availability of Special Report 240
Special Report 240 and its associated plates (maps) are available as free downloads or as printed products; prints are $128 each, plus $8 to cover shipping. NOTE: Plate 1 measures 36 inches by 42 inches; Plates 2A and 2B measure 42 inches by 46 inches each. To purchase printed copies, contact our
Publications Sales Desk or visit the California Geological Survey Library in Sacramento.
Revised Official Maps for Earthquake Fault Zones in Los Angeles County
June 15, 2017
On June 15, 2017 by the California Geological Survey (CGS) released three revised official maps of Alquist-Priolo Earthquake Fault Zones. Areas covered are within Los Angeles County and affect the cities of Arcadia, Los Angeles, Monrovia, Pasadena, San Marino, and South Pasadena. These maps are released under the authority of the Alquist-Priolo Earthquake Fault Zoning (AP) Act that was passed following the 1971 San Fernando earthquake. The
AP Act is a state law designed to reduce the hazard from surface fault rupture during an earthquake. Earthquake Fault Zones are regulatory zones that encompass surface traces of active faults that have a potential for future surface fault rupture. These revised maps show the location of AP Earthquake Fault Zones and Seismic Hazard Zones (if evaluated), and are collectively referred to as Earthquake Zones of Required Investigation.
List of Official Maps and Reports released June 15, 2017
-
Los Angeles quadrangle, showing Earthquake Fault Zones and Seismic Hazard Zones
- Related: Fault Evaluation Report 260
-
El Monte quadrangle, showing Earthquake Fault Zones and Seismic Hazard Zones
- Related: Fault Evaluation Report 264
-
Mount Wilson quadrangle, showing Earthquake Fault Zones and Seismic Hazard Zones
- Related: Fault Evaluation Report 264
The maps are available as GeoPDF files, which can be viewed using Adobe Acrobat Reader; a GeoPDF file consists of multiple layers and gives the user greater flexibility in viewing and displaying the maps. The maps are also available as digital Geographic Information System (GIS) files. GIS files for both AP Earthquake Fault Zones and Seismic Hazard Zones released by CGS are considered Official Maps.
To obtain these maps, reports and GIS data, visit the
Regulatory Maps and Reports section of the CGS Information Warehouse. To view individual parcels affected by Seismic Hazard Zones and/or Earthquake Fault Zones, visit our
Earthquake Hazards Zone Application ("EQ Zapp").
