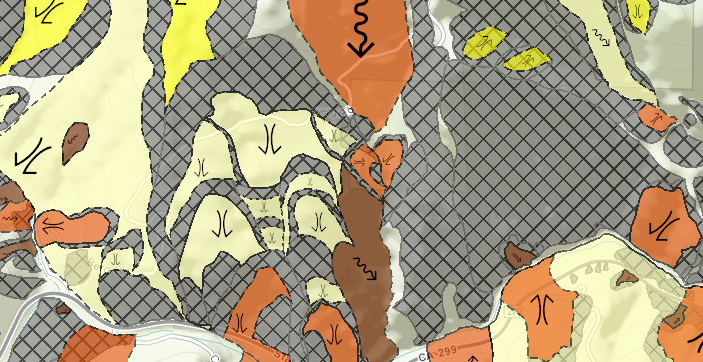
Landslides

A two-lane road in a river canyon, a portion of the road is covered by granite boulders and wood debris. The figure caption below provides more information.
Rockslide on California State Route 70 in the Feather River Canyon, Butte/Plumas county line, northern California. This slide was triggered on October 24, 2021 by a Category 5 atmospheric river, which released more than ten inches of rain in the area over a 48-hour period. Approximately seven thousand cubic yards of rock and debris buried and closed the highway; blasting was required to remove the larger slabs of granite from the roadway. Click/tap the image to open a high-resolution version of the entire scene.
Photo credit: Scott Tikalsky, California Department of Transportation.

Reported California Landslides Database*

Screen shot of the Reported California Landslides map.

Explore our Reported California Landslides database, an interactive map built on data sent to us by government agencies, media, and citizen scientists.

Please help contribute to this statewide database; send reports, maps, or photographs of recent landslides to: Calandslide@conservation.ca.gov.

*The Reported California Landslides database is not updated in real time, and does not reflect current landslide events. To read about recent landslide activity, visit CAGeoSurvey on Twitter.

In this section:

The California Geological Survey classifies landslides with a two-part designation based on Varnes (1978) and Cruden and Varnes (1996). The designation captures both the type of material that failed and the type of movement that the failed material exhibited.

Material types are broadly categorized as either rock or soil, or a combination of the two for complex movements. Rock refers to hard or firm bedrock that was intact and in place prior to slope movement. Soil, either residual or transported material, is used in the engineering sense to mean unconsolidated particles or poorly cemented rock or aggregates. Soil is distinguished further on the basis of texture as debris (coarse fragments) or earth (fine fragments). The distinction between rock and soil, and the further distinction between debris and earth is most often based on interpretation of geomorphic characteristics within landslide deposits, but can also be inferred from geologic characteristics of the parent material described on maps or observed in the field.

Landslide movements are interpreted from the geomorphic expression of the landslide deposit and source area, and are categorized as falls, topples, spreads, slides, or flows. Falls are masses of soil or rock that dislodge from steep slopes and free-fall, bounce, or roll downslope. Topples move by the forward pivoting of a mass around an axis below the displaced mass. Lateral spreads, commonly induced by liquefaction of material in an earthquake, move by horizontal extension and shear or tensile fractures. Slides displace masses of material along one or more discrete planes. In rotational sliding the slide plane is curved and the mass rotates backwards around an axis parallel to the slope; in translational sliding the failure surface is more or less planar and the mass moves parallel to the ground surface. Flows mobilize as a deforming, viscous mass without a discrete failure plane. More than one form of movement may occur during a failure, in which case the movement is classified as complex if movements occur sequentially and composite if they do not.

Five of the 20 possible material/movement combinations are commonly found when preparing a landslide inventory map. These are earth flows, debris flows, debris slides, rock slides, and rock falls, and are described in more detail below.


Earth Flows

Earth Flow

Diagram by J. Appleby, R. Kilbourne, and C. Wills after Varnes, 1978

An earth flow is a specific type of soil flow landslide where the majority of the soil materials are fine-grained (silt and clay) and cohesive. The material strength is low through much of the slide mass, and movement occurs on many discontinuous shear surfaces throughout the landslide mass. This movement along numerous internal slide planes disrupts the landslide mass leading to cumulative movement that resembles the flow of a viscous liquid characterized by a lumpy, or “hummocky” slope morphology. The lower parts of an earth flow usually bulge outward and are steeper than adjacent slopes.

Earth flows commonly occur on moderately steep slopes. Slope gradients are commonly from 10% to as steep as 30%, although steeper slopes may be found in headscarp and toe areas.

Earth flows typically are initiated by periods of prolonged rainfall and sometimes don’t initiate until well after a storm or the rainy season has passed. They are characteristically slow moving, in the millimeters or centimeters per day range, and may continue to move for a period of days to weeks after initiating.


Debris Flows

Debris Flow

Diagram by J. Appleby and R. Kilbourne, CGS

A debris flow is a soil flow where the majority of the materials are coarse-grained (fine sand to boulder size particles) and non-cohesive. Debris flows are most often triggered by intense rainfall following a period of less intense precipitation, or by rapid snow melt. High pore water pressures cause the soil and weathered rock to rapidly lose strength and flow downslope. Debris flows can move very rapidly, at rates ranging from meters per hour to meters per second and travel relatively long distances, making them a significant threat to life and property.

Debris flows commonly begin as a slide of a shallow mass of soil and weathered rock. Their most distinctive landform is the scar left by the original shallow slide. The path of the debris flow may be marked by a small drainage that has been stripped of vegetation. The debris flow may not leave any deposit if it flows directly into a larger creek and is immediately eroded away. Many debris flow deposits are ephemeral, but in some cases successive debris flows may deposit material in the same area thereby forming a debris fan, which resembles a small, steep alluvial fan.

Individual debris flows typically are small in areal extent and their deposits are relatively thin. Evidence of past debris flow movements often is masked by vegetation growth which can cover the surface rapidly, sometimes within a few years, making them difficult to identify using aerial photographic and field reconnaissance methods. Therefore, only the larger and more recent debris flows typically are identified and included on landslide inventory maps.


Debris Slides

Debris Slide

Diagram by J. Appleby, R. Kilbourne, and C. Wills after Varnes, 1978

A debris slide is a landslide of coarse-grained soil, most common in unconsolidated sandy or gravelly units, but also are common in residual soils that form from in-place weathering of relatively hard rock. Owing to the granular constituents, overall strength of the debris slide mass generally is higher than that of earth flows, but there may be a very low strength zone at the base of the soil or within weathered bedrock. Debris slides typically move initially as shallow intact slabs of soil and vegetation, but break up after a short distance into falls and flows. Movement of the slide mass as a shallow slab leads to a smooth, steep, commonly curved scar. The debris is deposited at the base as a loose hummocky mass, although the deposit may be rapidly removed by erosion.

Debris slides commonly occur on very steep slopes, as steep as 60% to 70%, usually in an area where the base of a slope is undercut by erosion. Debris slides form steep, un-vegetated scars which are likely to remain un-vegetated for years. Re-vegetated scars can be recognized by their steep slopes, and a shallow amphitheater morphology.

A single heavy rainstorm or series of storms may deliver enough rain to trigger debris slides. Individual debris slides may move at rates ranging from meters per day to meters per minute. Debris slide scars are extremely steep and therefore are very sensitive to renewed disturbance. Natural erosion at the base of debris slide scars may trigger additional slides. Cutting into the base of a debris slide scar may also trigger renewed slides. Even without additional disturbance, debris slide scars tend to ravel and erode, leading to small rock falls and debris slides from the same slope.


Rock Slides

Rock Slide

Diagram by J. Appleby, R. Kilbourne, and T. Spittler after Varnes, 1978

A rock slide is a landslide involving bedrock in which the rock that moves remains largely intact for at least a portion of the movement. Rock slides can range in size from small and thin to very large and thick, and are subject to a wide range of triggering mechanisms. The sliding occurs at the base of the rock mass along one to several relatively thin zones of weakness, which are variably referred to as “slide planes,” “shear surfaces,” “slip surfaces,” “rupture surfaces,” or “failure surfaces.” The sliding surface may be curved or planar in shape. Rock slides with curved sliding surfaces are commonly called “slumps” or “rotational slides,” while those with planar failure surfaces are commonly called “translational slides,” “block slides,” or “block glides.” Rock slides that occur on intersecting planar surfaces are commonly called “wedge failures.

Rock slides commonly occur on relatively steep slopes in competent rocks. Slope gradients are commonly from 35% to as steep as 70%. Movement of an intact rock mass along a curved slide plane leads to a steep, arcuate headscarp at the upper boundary of the slide. Immediately below the headscarp is a block that is commonly rotated so that it is less steep than the surrounding hill slopes. Below the bench, the slide mass may be intact with a similar gradient to the surrounding slopes or may have additional scarps and benches. The lower parts of the slopes may bulge outward and be steeper that the surrounding slopes.


Rock Falls

Rock Fall

Diagram modified after Colorado Geological Survey

A rock fall is a landslide where a mass of rock detaches from a steep slope by sliding, spreading or toppling and descends mainly through the air by falling, bouncing or rolling. Intense rain, earthquakes or freeze-thaw wedging may trigger this type of movement.

Rock falls occur on steep slopes of hard, fractured rock. The scar left by a rock fall on the slope may be no more apparent than an area of rock that is less weathered than the surrounding rocks. Rock fall deposits are loose piles of rubble that may be easily removed by erosion. Because neither the scar nor the deposit are distinctive, and because the most frequently occurring rock falls are typically small, individual rock falls are usually not shown on regional-scale (1:24,000 and smaller) landslide maps.

Though infrequent, moderate- to large-volume rock falls can be extremely dangerous and sometimes fatal. Large slabs of rock impacting a hard ledge after a long drop can rapidly break apart, leading to air entrainment and long runouts, induced airblasts, airborne projectiles (flyrock) and severe dust clouds.


In this section:

Since the 1960’s, the California Geological Survey (CGS) has produced numerous maps that show landslide features and delineate potential slope-stability problem areas. Preparation of these maps has been episodic, often driven by landslide disasters and subsequent legislative mandates. Many CGS landslide maps and related products have been produced for local or state agencies in response to their specific needs.

To find the landslide map that covers your area of interest, please see our Landslide Map Index. Refer to the explanation on that map and descriptions of the types of landslides and types of landslide maps for details on how landslides are mapped and described.

Types of Landslide Maps

Four principal types of information describing the various classes of landslides are portrayed by different landslide maps prepared by the California Geological Survey: (1) inventories of existing landslides, (2) landslide hazard—expressed as landslide susceptibility or landslide potential maps, (3) landslide risk maps, and (4) landslide zone maps. The maps can be either qualitative or quantitative in their preparation.

  1. Landslide-inventory maps, the most basic landslide maps, portray the location of prior failure. Because one clue to the location of future landsliding is the distribution of past movement, maps that show existing landslides are helpful in predicting the hazard. Inventory maps do not necessarily distinguish fresh movements, but in any one year some of the mapped slides—or more frequently, portions of them—may become active. A landslide inventory reveals the extent of past movement and thus the probable locus of some future activity within those landslides, but it does not indicate the likelihood of failure for the much larger area between mapped landslides. For this, hazard, risk or zone maps are required.
  2. Landslide-hazard maps describe an unstable condition arising from the presence or likely future occurrence of slope failure. There are two general types of landslide-hazard maps, each of which provides a different level of information and detail:
    1. Landslide-susceptibility maps describe the relative likelihood of future landsliding based solely on the intrinsic properties of a locale or site. Prior failure (from a landslide inventory), rock or soil strength, and steepness of slope are the three site factors that most determine susceptibility.
    2. Landslide-potential maps describe the likelihood of landsliding (susceptibility) jointly with the occurrence of a triggering event (opportunity). Potential commonly is based on the three factors determining susceptibility plus an estimate or measure of the probability (likelihood of occurrence) of a triggering event such as earthquake or excessive rainfall.
  3. Landslide-risk maps describe landslide potential jointly with the expected losses to life and property if a failure was to occur. The potential for landslide damage to a road system, for example, can be evaluated by considering the exposure of the roads to different levels of landslide hazard and the vulnerability of the roads to consequent damage. Similarly, the risk of excessive sedimentation in streams and other ecological damage can be evaluated by considering the landslide hazard jointly with the properties of streams and their sensitivity.
  4. Landslide-zone maps depict areas with a higher probability of landsliding, within which specific actions are mandated by California law prior to any development. These maps typically are binary in nature (a given site is either in or out of the zone) and are designed for use as planning tools by non-geoscientists. Zone maps may be derived from landslide potential or susceptibility, but some have been based simply on slope gradient or landslide-inventory maps.

Landslide hazard, risk and zone maps are prepared in many ways, increasingly involving complex manipulations of multiple criteria by computer. Because the value of landslide maps can be judged only by whether they correctly predict the locations of future failures, effectiveness of the different approaches to constructing them is difficult to evaluate.

Categories of Landslide Activity
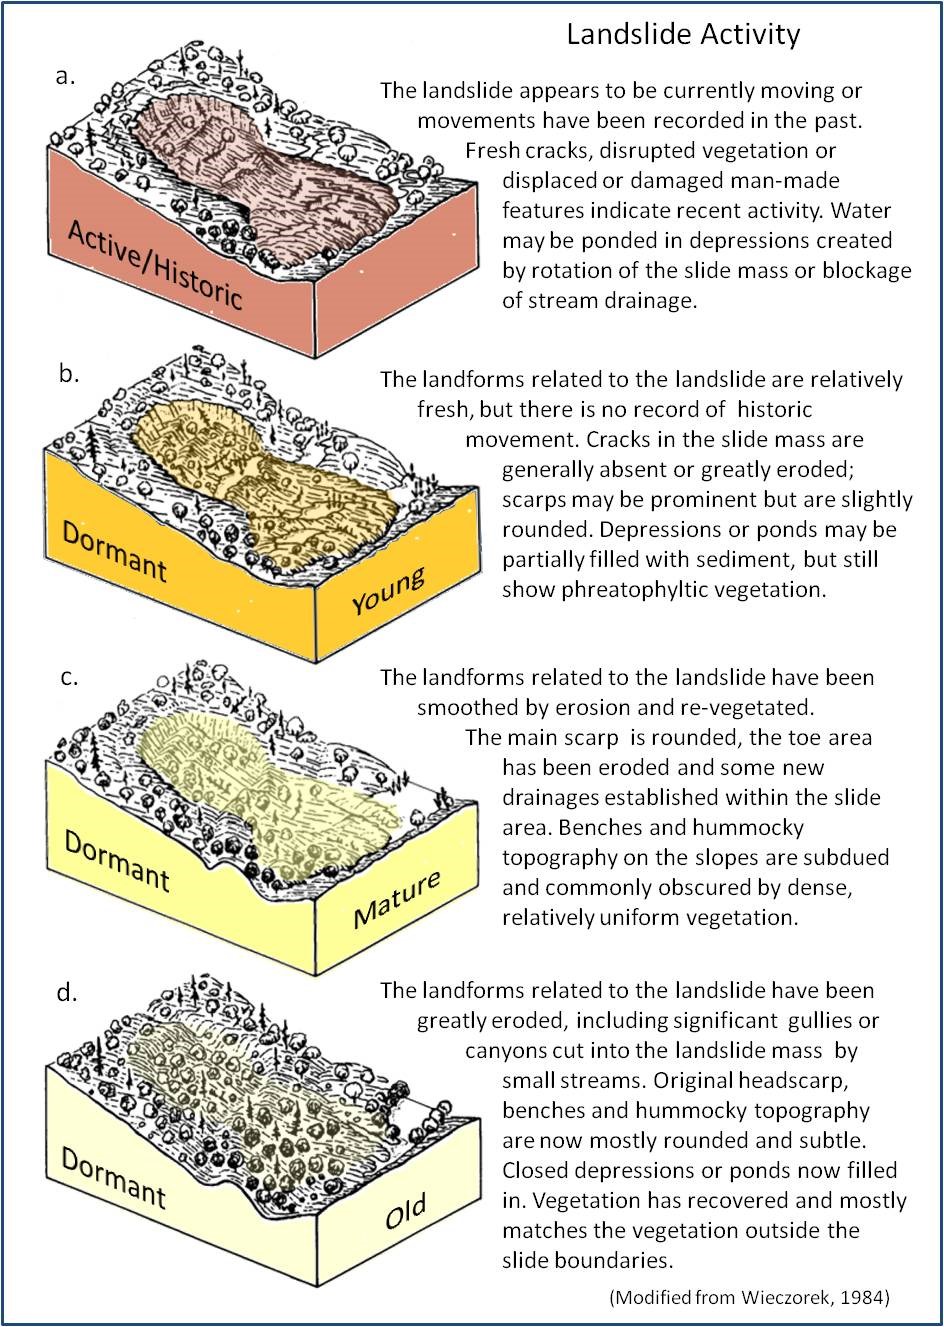
Each landslide is classified based on the recency of activity into one of four categories based on the system of Keaton and DeGraff, (1996). The landslide activity categories are graphically portrayed with the colors used to delineate landslide activity on the maps. The designation of activity shows an estimate of how recently the landslide moved, but also suggests the type of hazard represented. More recently active landslides are more likely to continue to fail, or to fail completely. Older landslides are less likely to move as single slide masses, but may be the source of smaller slides.

Confidence of Interpretation

Each landslide is classified according to a "confidence" that the geologic interpreter assigns to it, and can be regarded as a measure of the likelihood that the landslide actually exists.  Landslides are mapped on the basis of characteristic landforms, and the confidence of interpretation is based on the distinctness of those landforms. As a landslide ages after its last movement, erosional processes remove or cover the landforms that formed by landsliding. With time, these distinctive landforms become so subtle that they resemble landforms produced by geologic processes and conditions unrelated to landsliding.  The confidence of interpretation is depicted on a map by the use of different line styles (solid, dash, and dot).

Definite: Landslide exhibits many of the diagnostic landforms, including, but not limited to, prominent scarps, open cracks, rounded toes, offset streams, well-defined mid-slope benches, closed depressions, springs, and irregular or hummocky topography; or has clear records of prehistoric, historic or ongoing activity from reports, aerial photography or instrumental monitoring.

Probable: Landslide exhibits several of the diagnostic landforms commonly associated with landslides.  These landforms may be modified by erosion or obscured by vegetation such that other explanations are possible.  However, the preponderance of evidence strongly suggests that a landslide does exist.

Questionable: Landslide exhibits only one or a few of the diagnostic landforms associated with landslides. The landforms may be heavily modified by erosion, altered by grading, obscured by dense vegetation, or formed by other geologic processes such as differential erosion of lithologic and structural features in the underlying bedrock.

Translation of landslides from some legacy maps requires a geologist to interpret the original author's confidence from the graphics on those maps. Most commonly, older maps have two types of symbols indicating confidence: a landslide polygon is either shown with a query or with arrows indicating direction of movement. Where CGS compiled older mapping for this project, we reviewed aerial photos and discussed procedures with the original authors, if possible. Based on this review we have classified landslide areas shown with a query as "questionable" and others as "definite".

Cited References

Cruden, D.M., and Varnes, D.L. 1996, Chapter 3: Landslide types and processes, pp. 36-75 in A.K. Turner and R.I. Schuster (eds.), Landslides: Investigation and Mitigation, Special Report 247, Transportation Research Board, National Research Council, Washington D.C.: National Academy Press.

Keaton, J.R., and DeGraff, J.V., 1996, Surface observation and geologic mapping, in Turner, A.K., and Schuster, R.L., editors, Landslides Investigation and Mitigation: National Research Council Transportation Research Board Special Report 247, p.178-230.

Varnes, D.J., 1978, Slope movement types and processes. In, R.L. Schuster and R.J. Krizek (eds.), Landslides: Analysis and Control, National Research Council Transportation Research Board Special Report Special Report 176, National Research Council, Washington, D.C. pp. 11-33.

In this section:

History of Landslide Mapping at CGS

In the 1970’s, CGS prepared a series of “Geology for Planning” and “Environmental Geologic Analysis” reports and maps for local agencies in urbanizing areas. These products were designed to assist local agencies in evaluating hazards and developing policies that consider landslide hazards as residential development spread into landslide-prone terrain.

Following the 1982 El Nino storms in the San Francisco Bay area, the Landslide Hazard Mapping Act mandated new maps to show landslides and landslide hazards. Landslide Hazard Identification Maps were prepared by CGS for use by local government planners from 1986 to 1995. A set of three to four maps was prepared for each map study area, usually encompassing a USGS 7.5-minute topographic quadrangle map. The set of maps typically consisted of a geologic map, a landslide inventory map - showing the location and distribution of existing landslides – and one or two landslide relative susceptibility maps.

Also beginning in the early 1980’s, concerns about the long-term ecologic impacts of timber harvesting lead to the mapping of landslide features in forested lands. Maps developed under this program include landslide inventory maps, and depict other geomorphic features (e.g. debris-slide slopes and inner gorges) where shallow landsliding is a dominant mode of mass wasting.

Although the Geology for Planning, Environmental Geologic Analysis, and Landslide Hazard Identification programs are no longer in existence, their products are generally still available as paper prints or pdfs and most of the landslides from those maps have been included in the California Landslide Inventory, discussed in the next section.

Currently active landslide mapping programs at CGS, and their respective products, are summarized below.

Forest and Watershed Geology Program

Image of landslide in a forested watershed

The Forest and Watershed Geology Program provides maps and information on landslides, erosion, and sedimentation to help guide land-use decisions in California’s forested lands, and help preserve water quality and fish habitat.

Seismic Hazards Program

Residential property impacted by a landslide

The Seismic Hazards Program maps existing landslides and delineates landslide zones of required investigation. The zone maps, which also identify liquefaction hazards, identify areas where a site-specific study must be completed before a building permit is approved. Landslide Inventory Maps prepared for Seismic Hazard Zonation are now available as part of the CGS  Landslide Inventory Map Series

Highway Corridor Landslide Hazard Mapping

Landslide impacting a road

CGS has prepared a series of maps and reports for the California Department of Transportation (Caltrans) in the Highway Corridor Landslide Hazard Mapping project that evaluate the severity of landslide hazards along highway corridors through mountainous and potentially unstable terrain.

Technical Reports and Disaster Response

Disaster response

CGS regularly provides technical input and advice to the California Office of Emergency Services (CalOES) during and immediately following major landsliding events, and immediately following major wildfires in anticipation of post-fire debris flows. CGS provides brief reports on individual emergency response tasks to CalOES and local emergency response agencies to assist them in evaluating ongoing hazards and planning for recovery. Post-event reports and maps documenting landslide occurrences have been summarized as Open-File Reports, articles in California Geology magazine, and on CGS’s web pages.

The California Landslide Inventory is an ongoing project to collect and display landslide data for the State of California. These data include both the most recently mapped landslides and data developed over the past thirty years by the California Geological Survey and its collaborators. Multiple programs at the CGS create landslide data. Historically, each program created its own data standard to meet its specific needs. Between 2012 and 2015, the landslide mapping programs at CGS developed a common data standard for developing landslide data. These data have now been standardized into the Landslide Inventory, and new data will be developed in accordance with the Landslide Inventory's data standard.

The California Geological Survey is in the process of digitizing maps of landslides and has prepared a statewide landslide map database that is available online. The database shows many of the landslides mapped by CGS and others over the past 50 years. Mapping of landslides reflects the standards of the project and time the map was prepared. Many maps show landslide source areas (scarps) separate from landslide deposits, other maps combine scarps and deposits into a single feature. The amount of information recorded about each landslide has increased over time, so more information is available for more recently mapped landslides. Updates to the database are continuing, both to include more existing maps and to add current landslides as they occur. The landslide inventory, in combination with the map of susceptibility to deep-seated landslides (CGS Map Sheet 58) can give local planners, infrastructure owners, and the public a perspective on where landslides are most likely to be triggered by winter storms or by earthquakes in California. View the California Landslide Inventory.


Web page by:
California Geological Survey - Regional Geologic and Landslide Mapping Program and Burned Watershed Geohazards Program

 ‭(Hidden)‬ Custom CSS