Modeling Postfire Geohazards Prior to Wildfire Across California
The California Watershed Emergency Response Teams (WERTs) led by CAL FIRE and the CGS Burned Watershed Geohazards (BWG) Program uses USGS postfire debris-flow models to help make rapid assessments of postfire geohazards. The USGS postfire debris-flow models (Table 1) use burn severity data collected immediately after wildfires to predict debris-flow likelihood, volume, and rainfall intensity thresholds (e.g., Staley et al., 2016, Gartner et al., 2014). These postfire debris-flow hazard models require burn severity products that are only available after wildfires. To predict postfire debris-flow hazards prior to fire, the USGS developed an approach (Staley et al., 2018) that uses existing vegetation type (EVT) data to simulate differenced normalized burn ratio (dNBR), a satellite-derived product that quantifies the change in vegetation conditions from prefire to postfire, to create simulated burn severity maps (Key and Benson, 2006). EVT classes that represent grasslands typically produce low dNBR values while EVT classes that represent forests produce higher dNBR values. Simulated burn severity maps were used as inputs to the USGS postfire debris-flow likelihood and volume models to map potential postfire debris-flow hazards across southern California (Kean and Staley, 2021).
Table 1. Summary of USGS postfire debris-flow hazard models.
| Debris-flow likelihood (DFL) |
DFL = exp(X) / (1 + exp(X))
X = -3.63 + (0.41X1R) + (0.67X2R) + (0.7X3R)
X1 = proportion of upslope basin area burned at high or moderate severity with gradient in excess of 23 degrees
X2 = average dNBR of upslope basin area divided by 1000
X3 = soil erodibility index of the fine fraction of soils (i.e. Kf factor)
R = 15-minute rainfall accumulation (mm) |
Staley et al. (2016) |
| Debris-flow volume (DFV) |
DFV = exp(4.22 + 0.39sqrt(I15)) + (0.36ln(Bmh)) + (0.13sqrt(Relief))
Relief = upslope basin relief (m)
Bmh = upslope basin area burned at high or moderate severity (km2)
I15 = 15-min rainfall intensity (mm h-1) |
Gartner et al. (2014) |
| Rainfall intensity-duration threshold (T, mm h-1) |
T = (ln(DFL/(1-DFL)) + 3.63) / ((0.41X1R) + (0.67X2R) + (0.7X3R))
DFL = likelihood value used for debris-flow threshold (i.e. DFL = 0.5)
X1 = proportion of upslope basin area burned at high or moderate severity with gradient in excess of 23 degrees
X2 = average dNBR of upslope basin area divided by 1000
X3 = soil erodibility index of the fine fraction of soils (i.e. Kf factor) |
Staley et al. (2016) |
CGS expanded the Kean and Staley (2021) approach by using regionally calibrated burn severity to predict postfire debris-flow hazards prior to wildfire for the entire state of California (Rossi et al., 2025). CGS used the relationships between historical dNBR and EVT developed by the USGS (Staley, 2018) to simulate dNBR from EVT (Figures 2 and 3a-b) and calibrated the simulated dNBR for eight regions across the state with historical (2020-2021) wildfire burn severity data from the Monitoring Trends in Burn Severity (MTBS) database (Rossi et al., 2025). The simulated dNBR map was then classified with Burned Area Reflectance Classification breaks from the calibration fires from the MTBS database by region (Figure 3c). As the primary goal of the modeling effort is to predict postfire debris-flow hazards, the calibration and the BARC classification focused on the low-moderate BARC breaks instead of moderate-high BARC breaks because the USGS debris-flow hazard models do not distinguish between moderate and high BARC break values. When using the simulated BARC map to quantify areas of low, moderate, and high burn severity for postfire hydrologic analyses, the proportion of moderate and high burn severity should be closely evaluated and, if necessary, adjusted to align with the moderate-high BARC classification values of historical fires in the region. CGS then used the simulated dNBR and BARC maps (Figure 3b-c) to run the USGS postfire debris-flow likelihood and volume models (Table 1; Figure 2), which estimate a rainfall-intensity threshold (Figure 4c), debris-flow likelihood (Figure 4d), debris-flow volume (Figure 4e), and combined hazard class (Figure 4f).
The USGS postfire debris-flow model assumes that a site has already burned and does not account for wildfire being more likely in some parts of the state than others. The model also does not account for a given rainfall intensity being common in a wet region of the state but rare in a dry region. To address these limitations, CGS combined a predicted annual probability of fire occurrence product (Figure 4h; Vogler et al., 2021) with the annual probability of above-threshold rainfall product (Figure 4g) based on climatological data to predict annual probability of postfire debris-flow occurrence. The result (Figure 4i) is a statewide map showing the annual probability that a given area experiences wildfire and then, within one year, experiences rainfall exceeding the modeled debris-flow threshold. This model prediction forms the basis for CGS Map Sheet 69.
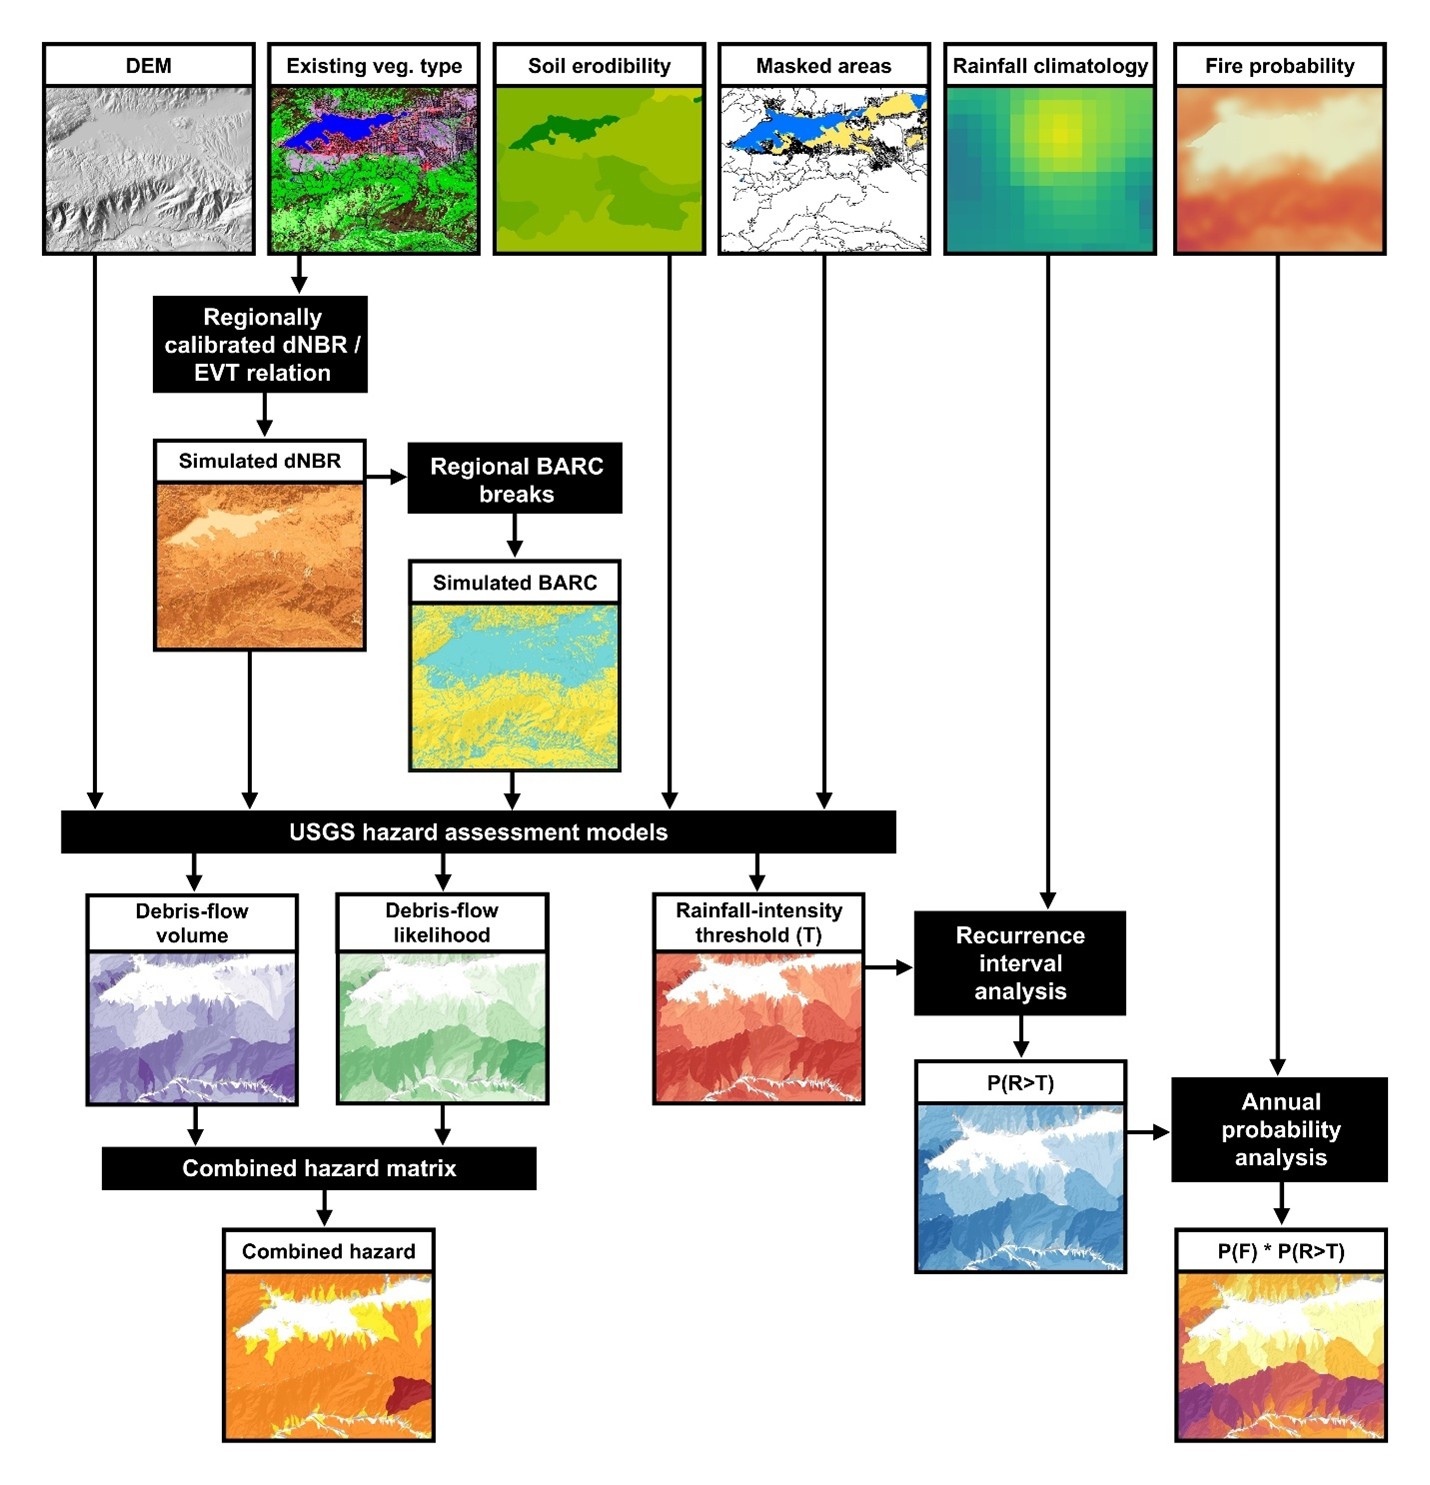 Figure 2. Flowchart from Rossi et al. (2025) outlining the prefire hazard modeling methods and model inputs/outputs associated with statewide map products (Figure 4). CGS used a 15-min rainfall intensity of 24 mm h-1 as an input to the debris-flow likelihood and volume models. Abbreviations: DEM, Digital Elevation Model; BARC, Burned Area Reflectance Classification; dNBR, differenced Normalized Burn Ratio; EVT, Existing Vegetation Type; R, rainfall intensity; T, modeled rainfall intensity threshold; P(R > T), annual probability that the 15-min triggering rainfall intensity is exceeded for a debris-flow likelihood value of 50%; P(F), annual fire probability; P(F) * P(R > T), annual probability of a fire and subsequent above-threshold rainfall intensity within the year following fire.
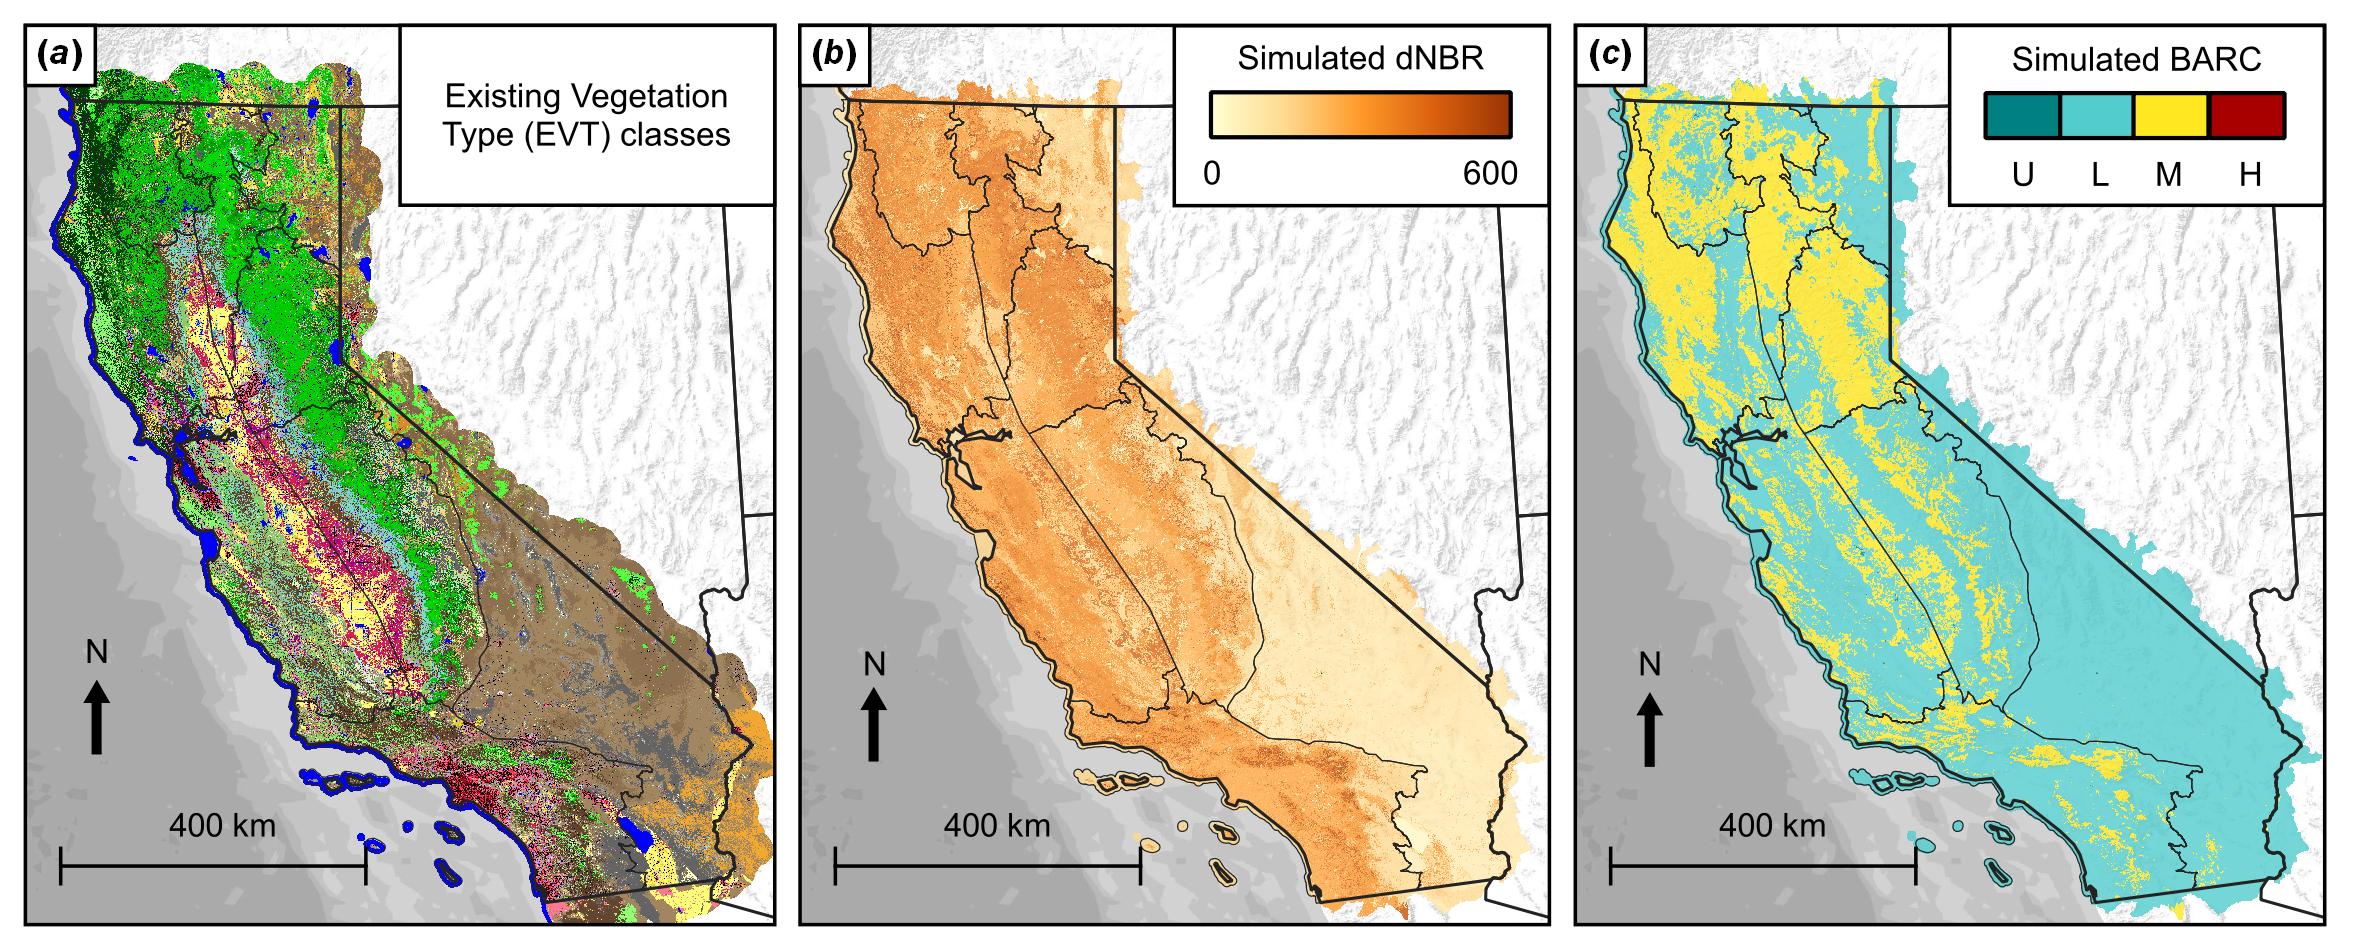 Figure 3. Map showing (A) the spatial distribution of Landfire EVT classes across the state, used to generate the (B) simulated dNBR and (C) simulated BARC maps. Prefire calibration regions are outlined with thin black lines. Abbreviations: BARC, Burned Area Reflectance Classification; dNBR, differenced Normalized Burn Ratio; EVT, Existing Vegetation Type.
Potential Applications for Geohazard Mitigation Prior to Wildfire
The results of the statewide pre-fire modeling and mapping effort (Figure 4) can be used for multiple applications (Table 2). For example, the postfire debris-flow likelihood and volume predictions can be used to assess threats to downstream values at risk (e.g., homes, bridges, and other infrastructure), estimate sediment volumes and flow properties used to parameterize hydraulic models (Pak et al., 2023), and inform potential mitigation efforts. The results can also be used to inform active fire suppression operations and emergency response efforts during a wildfire. For long-term planning, the results can be used to prioritize fuels reduction projects across the state (such as vegetation thinning and prescribed burning) and used by local governments to inform residential development plans, zoning maps, and local hazard mitigation plans.
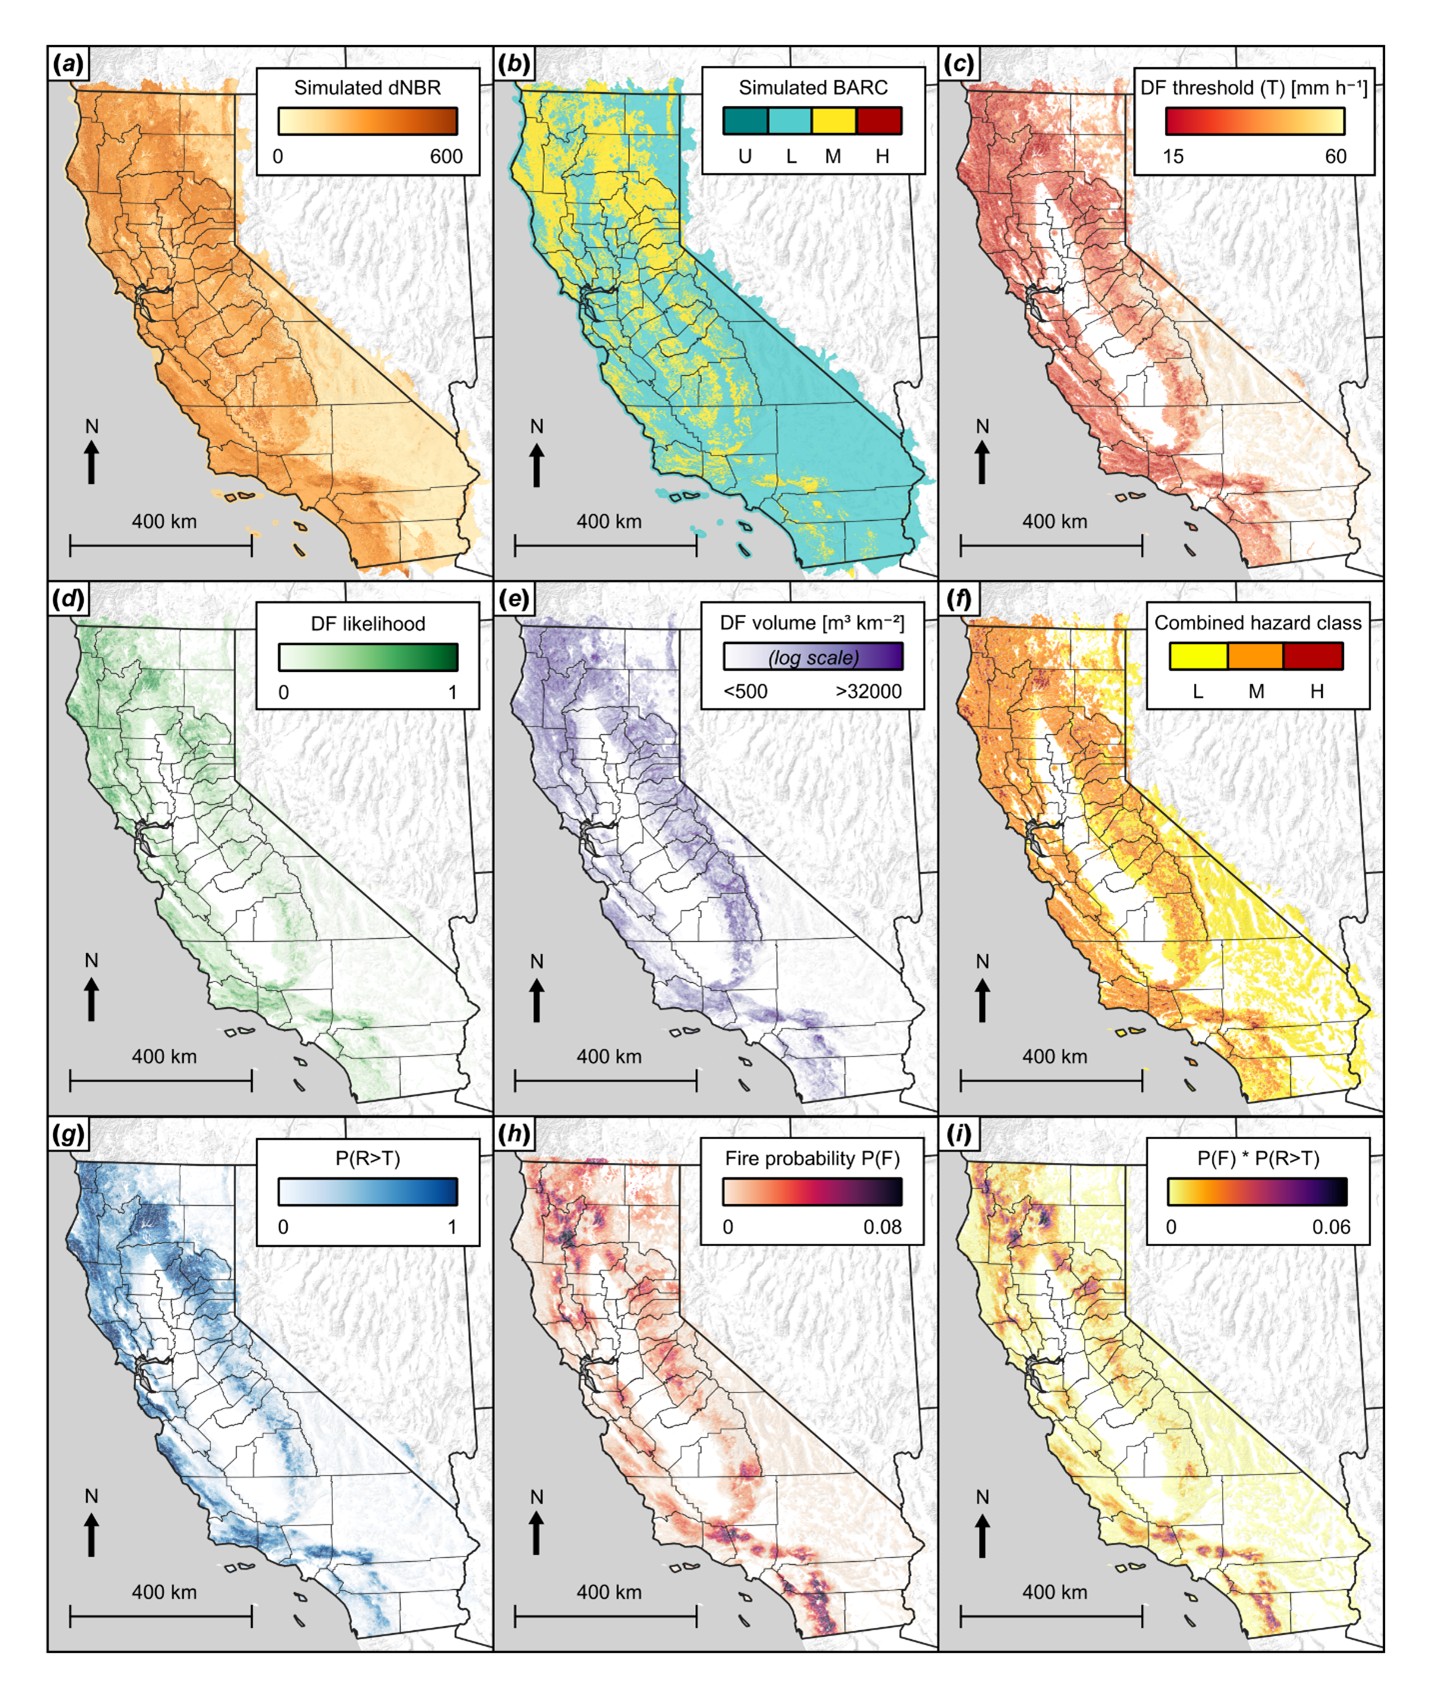 Figure 4. Statewide prefire model outputs from Rossi et al. (2025). Panel descriptions are listed in Table 2.
Table 2. Potential applications of prefire model outputs.
| A. Simulated differenced Normalized Burn Ratio (dNBR) |
Pre- to postfire hydrology using Moody (2012) |
| B. Simulated Burned Area Reflectance Classification (BARC; U: unburned/very low, L: low, M: moderate, H: high) |
Used to inform fire severity and potential postfire hydrology |
| C. Debris-flow (DF) 15-minute rainfall intensity threshold (T) in mm h-1 |
Estimate triggering rainfall intensity thresholds of postfire debris flows |
| D. Debris-flow likelihood from 24 mm h-1 storm |
Inform potential debris-flow hazards and fixed bulking factors used in postfire hydrology |
| E. Debris-flow volume (normalized to basin area) |
Used to characterize postfire sediment yield for infrastructure screening and design |
| F. Debris-flow combined hazard class (L: low, M: moderate, and H: high) |
Estimates postfire hazard as a function of likelihood and consequence |
| G. Annual probability that the 15-minute triggering rainfall intensity (T) is exceeded for a debris-flow likelihood value of 50% (P(R>T)) |
Identifies areas at greatest risk of postfire debris flows |
| H. Annual fire probability |
Identifies areas of greatest risk of wildfire |
| I. Annual probability of a fire and subsequent above-threshold rainfall intensity within the year following fire (P(F) * P(R > T)) |
Identifies areas at greatest risk of wildfire followed by a triggering postfire debris flow rainfall event |
Limitations of the Model
The statewide mapping products are subject to the following limitations:
1. This model is intended for regional and statewide assessments and is not suitable or intended for site-specific hazard and risk evaluations. Most of the data used to calibrate debris flow likelihood come from the San Gabriel Mountains (SGM). As a result, model performance is best in the SGM and other areas with similar sediment transport characteristics. In many regions outside southern California, the model tends to overpredict debris flow occurrence. The results are most useful for comparing the relative likelihood of debris flows within a region (for example, the SGM). Although a regional calibration was applied, the results should still be used cautiously when comparing debris flow likelihood across different regions (such as between northern and southern California).
2. The model estimates the annual likelihood of a postfire debris flow occurring in a given basin (contributing area of 0.025 to 8 km2). Areas estimated to have ~0% debris-flow likelihood are generally flat and not conducive to debris-flow initiation. The model does not predict the runout behavior of debris flows traveling from steep source areas on to relatively flat terrain.
3. Burn severity was simulated with a relatively limited range in dNBR values based upon existing vegetation type classification values and does not fully model real fire behavior.
4. Although the annual probability of debris flow product is useful for identifying potential postfire debris-flow hazards, it was not developed to accurately quantify postfire changes in watershed conditions that can influence runoff and caution is advised for using the simulated burn severity products in estimating postfire runoff.
5. Information for some areas of the map could be improved by updating multiple input datasets, including the EVT-dNBR relationships, EVT dataset (2022), and the FSim annual fire probability dataset (valid from August 2022).
Future Improvements to Postfire Geohazard Models
Improved techniques and additional data collection should help improve the prefire inputs and postfire models. For example, EVT is useful for estimating future burn severity, but new methods are being developed that will improve our ability to predict wildfire burn severity. Conditions prior to wildfire such as daily fire weather (air temperature, wind speed and direction, relative humidity, etc.) and fuel moisture are critical drivers of fire behavior but are not known far in advance; these limitations hamper our ability to incorporate critical fire factors into models that predict burn severity. However, other important factors such as topography (elevation, aspect, landscape location), proximity to developed areas, road density, fuel loads, rock type, and seasonal climatic information can be considered prior to fire occurrence. Klimas et al. (2024) successfully demonstrated the value of incorporating additional factors to predict wildfire burn severity. They found that vegetation productivity, elevation, and canopy fuels were the most important predictor variables in forested land in Utah. Expanding this machine learning approach to California is promising for improving burn severity predictions, a critical input to postfire debris-flow models.
This product represents Version 1 of the modeling effort, which is based on 2022 vegetation conditions and therefore most representative of 2023 postfire debris-flow potential rather than general debris-flow susceptibility. CGS will issue new versions of this map as methods improve and datasets are updated.
Data
Data for the maps presented on this web page can be obtained in the Datafiles section below.
