SMARA Mineral Land Classification

Introduction

San Rafael Rock QuarryIn 1975, the California legislature enacted the Surface Mining and Reclamation Act (SMARA). This act provides for the reclamation of mined lands and directs the State Geologist to identify and map the non-fuel mineral resources of the state to show where economically significant mineral deposits occur and where they are likely to occur based upon the best available scientific data. While reclamation of mined lands falls within the purview of the Division of Mine Reclamation, the process of inventorying the non-fuel mineral resources of the state (called "mineral land classification") is a principal responsibility of the California Geological Survey; specifically, its Mineral Resources Program.

Although all mineral commodities mined in California are studied, special emphasis has been given construction aggregate because it is the state’s most important mineral commodity in terms of tonnage, value, and societal infrastructure. As California’s population continues to grow, the demand for minerals—especially building construction minerals such as aggregate—will similarly grow. Over 90% of these essential construction resources are transported by truck because unit trains and marine transport, although used, are currently uncommon in the state. Because such high-volume low-cost construction minerals are expensive to transport, and in order to minimize the environmental effects of transporting these resources from distant sources, it is beneficial—both economically and environmentally—that sand, gravel, and crushed stone resources be mined in reasonable proximity to growing communities.

Non-fuel mineral resources occur in unique geological settings and, therefore, must be mined where they are found. Although land-use competition between mining and other interests is inevitable, it need not be contentious if adequate planning based on objective and accurate mineral resource data are made available to local land-use planners, elected decision makers, the mining industry, and the public. The information presented in classification reports is as accurate as is feasible to assemble at the time of the study. Mineral land planning decisions made today will impact future generations. The intent of classification is to assist lead agencies, planners, and the public in the wise use, management, and conservation of California’s mineral resources.

MLC Guidelines and Petition Information

In addition to the state's self-initiated classification activity, individuals and organizations may petition the State Mining and Geology Board (SMGB) to classify mineral lands that are claimed to contain significant mineral deposits. For complete information, please see SECTION III. GUIDELINES FOR CLASSIFICATION AND DESIGNATION PETITIONS starting on page 9 of the SMGB's Guidelines for Classification and Designation of Mineral Lands.

The "Petition for Classification-Designation of Mineral Lands" form can be found in Appendix A of the aforementioned SMGB Guidelines document. For your convenience, the SMGB provides a standalone version of the Classification Petition form on their web site.

Completed Petitions should be sent to:

The California State Mining and Geology Board
Attn: Jeffrey Schmidt
715 P Street, MS 1909
Sacramento, CA 95814

Make Check payable to: The State Mining and Geology Board

MLC Maps and Reports

The primary products of CGS mineral land classification are maps and reports. Local agencies are required to use the classification information when developing land-use plans and when making land-use decisions. This section provides access to our collection of over 200 MLC products.

MLC Publications Index [updated August 2022]

Publications o​​f the SMARA Mineral Land Classification Project dealing with Mineral Resources in California is a printer-friendly list of all mineral land classification reports produced by the California Geological Survey, except any reports below denoted by [Recent Release].

Special Report 253 - Mineral Land Classification: Portland Cement Concrete Aggregate in the Western Ventura County and Simi Production-Consumption Regions

by Greg Marquis, 2022

Summary of SR 253

SR 253 is the second update Mineral Land Classification (MLC) report for Portland cement concrete (PCC) aggregate in Ventura County. The original MLC report was published as SR 145 in 1981. The first update was published as Open-File Report 93-10 in 1993. SR 253 reevaluates PCC aggregate resources, permitted reserves, past production, and includes an updated 50-year projection (through the year 2067) of demand for PCC and all other grades of construction aggregate in the Western Ventura-Simi Production-Consumption Regions.

The following list summarizes some of the major findings and conclusions reached in this update report:

  • Of the 27,179 acres of Designated Sectors in the WVS P-C Regions, 1,674 acres (6.2 percent) were lost due to land uses incompatible with mining.
  • There are an estimated 5,593 million tons of PCC resources in the WVS P-C Regions. 118 million tons are currently permitted.
  • The 118 million tons of permitted PCC aggregate reserves could last less than 23 years.
  • The WVS P-C Regions PCC aggregate reserves are approximately 80 percent fine and 20 percent coarse.
  • Approximately 25 percent of aggregate (coarse PCC aggregate) was imported to the WVS P-C Regions in 2017.
  • Imports to the WVS P-C Regions are transported at least 40 miles, which increases costs and greenhouse gas emissions.
  • Barriers to future mine permitting include housing, parks, environmental policies and land use decisions protecting wildlife habitat.

Special Report 255 - Mineral Land Classification of the Teichert Shifler Property, Yolo County, California, for Portland Cement Concrete Aggregate

by Greg Marquis, 2021

Summary of SR 255

Teichert Materials submitted a petition dated September 30, 2020 to the SMGB for classification of the Shifler Property, located approximately three miles west of the town of Woodland in Yolo County, just south of Cache Creek. The property consists of two parcels totaling 442 acres. The project area comprises 277 acres. The project area was most recently classified in CGS Special Report (SR) 245 in 2018. Portions of the project area were classified in SR 245 as not having significant mineral resources based on an analysis of surficial geologic mapping. Under the provisions of the Surface Mining and Reclamation Act of 1975 (SMARA), the petitioner requested that the State Geologist reclassify the project area as MRZ-2 for PCC aggregate.

The State Geologist investigated the area proposed for mining, and subsequently reclassified it as Mineral Resource Zone 2 (MRZ-2) for Portland cement concrete (PCC) aggregate. The petition contains drill logs that show the presence of construction aggregate at mineable depths throughout the project area. The petition also references a third-party laboratory that concluded the project area aggregate was suitable for use in PCC based on petrographic analysis. In addition to evidence provided in the petition, adjacent properties—also located off-channel from Cache Creek—are being or have been mined for PCC aggregate. The value of the aggregate resource in the project area exceeds the threshold for a significant deposit of construction materials for the purpose of classification.

Special Report 254 - Update of the Mineral Land Classification for Portland Cement Concrete Aggregate Resources in the San Fernando Valley and Saugus-Newhall Production-Consumption Regions

Preview of SR 254 Plate 1, map of San Fernando Valley and Saugus-Newhall Mineral Resource Zones.by Catherine Wesoloski, David Reioux, and Brenda Callen, 2021

Summary of SR 254

This report, Special Report (SR) 254, serves as an update to the findings presented in SR 143 parts I, II (Anderson and others, 1979), and V (Joseph and others, 1987) and Open-File Report (OFR) 94-14 (Miller, 1994). It includes: 1) a reevaluation of Portland cement concrete (PCC) aggregate resources within the San Fernando Valley and Saugus-Newhall Production-Consumption (P-C) Regions; 2) estimates for the quantity of resources as of December 2018; and, 3) a 50-year forecast of PCC aggregate demand within the San Fernando Valley and Saugus-Newhall P-C Regions from 2018 to 2068.

The major findings are:

  • No new sectors were added; the four sectors classified in the San Fernando Valley P-C Region and the three sectors classified in the Saugus-Newhall P-C Region were maintained from SR 143 and OFR 94-14.
  • The projected 50-year PCC aggregate demand on the San Fernando Valley P-C Region through the year 2068 is estimated to be 959 million tons.
  • The projected 50-year PCC aggregate demand on the Saugus-Newhall P-C Region through the year 2068 is estimated to be 80 million tons.
  • Reserves are proprietary but will be exhausted in less than 10 years in both regions if the current demand is sustained.
  • Approximately 416 million tons of resources underlie the San Fernando Valley P-C Region.
  • Approximately 10.5 billion tons of resources underlie the Saugus-Newhall P-C Region.
  • If no additional reserves become available, both the San Fernando Valley and Saugus-Newhall P-C Regions will remain dependent on external sources of PCC aggregate.

Special Report 252 - Update of the Mineral Land Classification for Concrete Aggregate Resources of Merced County, California

Preview of SR 252 Plate 1, map of Merced County Mineral Resource Zones.by Benjamin Parrish, 2021

Clicking the links above will take you to our File Request system, where you can request high-quality PDF versions of the documents. You will need to provide your email address, but other than that the process is quick, and you receive a file link within five minutes of requesting it.

Special Report 245 - Mineral Land Classification: Concrete Aggregate in the Greater Sacramento Area Production-Consumption Region

Preview of SR 245 Plate 1, map of the Greater Sacramento Area Production-Consumption Region.by Matt D. O'Neal and Fred W. Gius, 2018

Summary of SR 245

Urban expansion in the Greater Sacramento Area Production-Consumption (P-C) Region threatens to preclude mineral resource extraction. At present, the P-C Region contains sufficient concrete aggregate resources to meet the projected 50-year demand. However, there is a substantial and important disparity between the geographic distribution of mineral resources and population centers. Only a minor proportion of resources are located near population centers. Utilization of more distant resources results in a significant increase in cost to the aggregate consumer, road wear and tear, traffic congestion, greenhouse gas emissions, and air pollution. For example, each additional mile of aggregate transport costs 15 cents per ton, and one mile of a six-lane highway consumes more than 110,000 tons of aggregate.

Special Report 245 and its associated plates (maps) are available as free downloads or as printed products. (NOTE: The plates measure 36 inches by 48 inches each.) To purchase printed copies, contact our Publications Sales Desk or visit the California Geological Survey Library in Sacramento.

2018 Update to Map Sheet 52 - Aggregate Sustainability in California

Preview of Map Sheet 52, Aggregate Sustainability in California.by John P. Clinkenbeard and Fred W. Gius

Background of Map Sheet 52

Sand, gravel, and crushed stone are “construction materials.” These materials, collectively referred to as aggregate, provide bulk and strength to portland cement concrete, asphaltic concrete, Class II base, and other aggregate commodities such as subbase, drain rock, and fill. Aggregate normally provides 80 to 100 percent of the material volume in these uses.

The building and paving industries in California consume large quantities of aggregate and future demand for this commodity is expected to increase throughout California. Aggregate materials are essential to modern society, both to maintain the existing infrastructure and to provide for new construction. Because aggregate is a low unit-value, high-bulk-weight commodity, it must be obtained from nearby sources to minimize economic and environmental costs associated with transportation. These factors make information about the availability and demand for aggregate valuable to land-use planners and decision makers charged with planning for a sustainable future for California’s citizens.

Map Sheet 52 was originally published in 2002 and subsequently updated in 2006 and 2012. Map Sheet 52 (2018) is an update of the version published in 2012. The estimates of permitted reserves, aggregate demand, and years of permitted reserves remaining are based on conditions as of January 1, 2017.

Summary of Map Sheet 52

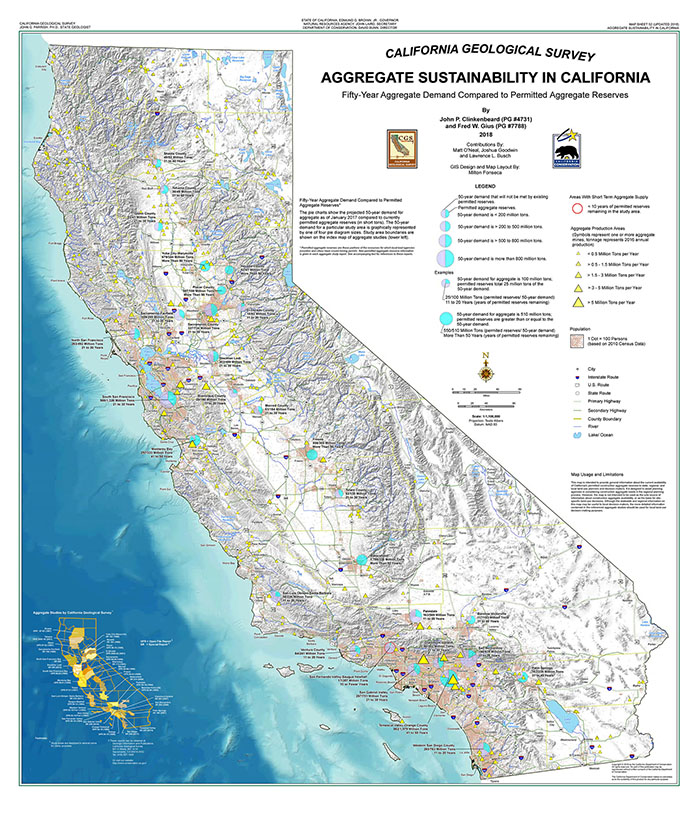
Map Sheet 52 is a statewide overview of projected future aggregate needs and currently permitted reserves. The purpose of the map is to compare projected aggregate demand for the next 50 years with currently permitted aggregate reserves in various regions of the state. The map also shows the projected years of permitted reserves remaining and highlights regions where fewer than 10 years of permitted aggregate supply remain.

The following conclusions can be drawn from Map Sheet 52 (2018) and the accompanying report:

  • In the 30-year period from 1987 to 2016, Californians consumed an average of about 180 million tons of construction aggregate (all grades) per year or about 5.3 tons per person per year.
  • In the next 50 years, the study areas identified on Map Sheet 52 will need approximately 11 billion tons of aggregate.
  • The study areas currently have about 7.6 billion tons of permitted reserves, which is about 69 percent of the total projected 50-year aggregate demand identified for these study areas. This is about 10 percent of the total aggregate resources located within the study areas.

Comparing regional needs to available reserves and resources demonstrates the important aggregate resource issues facing lead agencies in California. These issues include the need to plan carefully for the use of lands containing these resources and the need to consider the permitting of additional aggregate resources before currently permitted deposits are depleted.

Map Sheet 52 and its companion report are available as free downloads or as printed products; prints are $25 each, plus $8 to cover shipping. (NOTE: the map measures 36 inches by 42 inches.) To purchase printed copies, contact our Publications Sales Desk.

NOTE: Aggregate reserves and projected aggregate demand shown on Map Sheet 52 are updated from mineral land classification reports published by CGS between 1979 and 2017. Although the statewide and regional information presented on the map and in the accompanying report may be useful to decision-makers, it should not be used as a basis for local land-use decisions. The more detailed information contained in each of the aggregate studies employed in the compilation of Map Sheet 52 should be used for local land-use and decision-making purposes.


Web page by:
California Geological Survey - Mineral Resources Program

 ‭(Hidden)‬ Custom CSS

​​