A summary of past efforts to map the geology of the entire state of California.
Modified from Charles W. Jennings (1985) California Division of Mines and Geology Bulletin 201.
More than 100 years have passed since the preparation in 1891 of the 1:750,000 scale Preliminary Mineralogical and Geological Map of the State of California. The 2010 editions of the Geologic Map of California and the Fault Activity Map of California are the latest in the series of statewide geologic maps published by the State, and represent a step forward in the mapping and understanding of California's diverse geology.
The First Attempts
 Geologic mapping in California began about 180 years ago. The first geologic mapping in the State, done by Lieutenant Edward Belcher, a British naval officer, was a remarkably accurate geologic map of the Port of San Francisco. Although Belcher did the surveying for the map in 1826, it was not published until 1839.
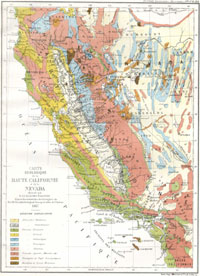 Landmarks in the publication of early geologic maps of the entire state begin with the hand-tinted geologic map of California made by W.P. Blake in 1853 and published in Volume V of the War Department's "Report of Explorations in California for Railroad Routes" (Blake, 1857). Utilizing nine geologic units, this 41 X 56 cm (16 x 22 inch) map was the first published geologic map that specifically and exclusively pertained to California. This map was followed by the first color-lithographed map of the State, made in 1867 and published four years later in Paris as part of a report of a French scientific mission to Mexico and the "ancient Mexican possessions of the north" (Guillemin-Tarayre, 1871). The geology is portrayed in a most impressive manner by ten geologic units, and the geologic interpretation is much improved over Blake's map.
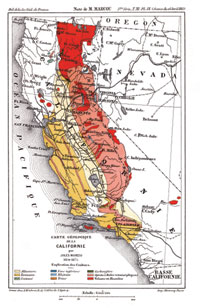 The second color-lithographed geologic map of California was prepared by another Frenchman, Jules Marcou (1883), and published in the "Bulletin of the Geological Society of France." The nine geologic units shown were largely based on Marcou's observations while working with the Pacific Railroad Survey in 1854 and the Wheeler Survey West of the 100th Meridian in 1875, both Federal surveys. The map was accompanied by a report on the geology of California.
These early, page-size geologic maps of the State were superseded in 1891 by the first large-format statewide geologic map.
1891 Preliminary Mineralogical and Geological Map of the State of California
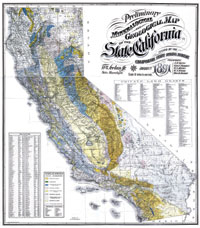 The Preliminary Mineralogical and Geological Map of the State of California, at a scale of 1:750,000 (1 inch on the map equals 12 miles on the ground), was prepared and published in four sections by the California State Mining Bureau. Beginning with this map, the responsibility for preparing and publishing succeeding editions of relatively large-scale geologic maps of California has remained with the State. Only eight geologic units were depicted on the 1891 map; however, their general relations are better shown than on all the previous geologic maps. Special emphasis was given to mineral resources. Such units as auriferous gravel, auriferous slate, and limestone are portrayed, and the locations of known mineral deposits are shown. The map was issued by the State Mineralogist, William Ireland, but the map compiler is not credited on the map. However, the 10th Annual Report of the State Mineralogist (Ireland, 1890, p. 21) states that the topographical and other work on the Preliminary Geological and Mineralogical Map was "being executed by Mr. Julius Henkenius, who received aid in the geological and mineralogical locatings from the Field Assistants."
1916 Geological Map of the State of California
 Twenty-five years after the 1891 Preliminary Mineralogical and Geological Map of the State of California, another 1:750,000 scale state geologic map was published by the California State Mining Bureau. This map was prepared by J. P. Smith, Professor of Paleontology at Stanford University, and was accompanied by a brief bulletin describing the geology (Smith, 1916).
The map legend lists 21 geologic units. Although Professor Smith's bulletin clearly explains that certain areas of California were still unmapped, his map, unlike the earlier 1891 edition, shows the entire area of the state covered by colors representing geologic units with delineated contacts. This, unfortunately, leaves the map-user without any clue as to what is known and what has merely been projected. The absence of geologic faults on this map is also somewhat puzzling. Although faults were by this time widely recognized and mapped—as, for example, in the atlas accompanying the "State Earthquake Investigation Commission" report on the disastrous 1906 San Francisco earthquake— not even the San Andreas fault is shown on the 1916 geologic map of California.
The 41-page bulletin, "The Geologic Formations of California," which accompanies the 1916 Geological Map of California, consists of an expanded legend for the reconnaissance geologic map; a description of the geologic record of California; a description of the "rock-forming agencies of California" wherein the formation of various rock types are briefly discussed; a listing of the sources of data for the geologic map; and, lastly, a listing of the formations included in each geologic unit shown on the map.
Download a pdf version of the 1916 map (84 megabytes. We recommend you right click the link and select "save link as").
1938 Geologic Map of California
 Twenty-two years later, another milestone in California geologic maps appeared in the form of a 1:500,000 scale map published in six sections by the California Division of Mines. This map was prepared by Olaf P. Jenkins, Chief Geologist of the Division of Mines, and represented nine years of careful geological research.
Much larger in scale than any preceding geologic maps of the state, the 1938 map shows much more detail than the earlier maps. The geologic boundaries of the 81 units depicted were drawn with greater precision than before. Care was taken to follow the source data faithfully. In areas where no geologic maps were available, or where previous maps were too general in nature or at a scale much smaller than the base map, the area was purposely left blank. This portrayal of the geology of the state showed that about 25 percent of the state was unmapped. The largest unmapped areas at that time were in the Klamath Mountains, the northern Coast Ranges, the southern Sierra Nevada, and the desert areas of southeastern California. For the first time, faults were shown on an official geologic map of California.
1958-1969 Geologic Atlas of California
The ground work for the Geologic Atlas of California began in 1951, after the popular 1938 edition went out of print. Great demand prompted OIaf P. Jenkins to set up a program for preparing a new edition of the state map that would incorporate the large amount of new geologic data collected since the earlier map was compiled (Jahns, 1961). The first map to be completed, the Death Valley Sheet, was published in 1958. At the outset of the project, the difficulties associated with compiling a geologic map of the entire state, with all of its geologic diversity and complexity, were for the most part recognized, but it was hoped that the abundance of new data on hand would make overcoming these difficulties fairly simple. Actually, the inconsistent nature of these new data made the task more difficult. The source maps for some areas of the state were excellent; in other areas they were very poor, incomplete, or simply nonexistent. Frequently, well-described areas were adjacent to poorly understood, incompletely mapped, or totally unmapped areas. Often, too, there was no continuity between maps for adjacent areas because of differences in geologic interpretation. Thus, the compilation could easily have resulted in a patchwork of data. Fortunately, perhaps, the scale of the atlas made it possible to ignore a multitude of discrepancies. Numerous problems, however, had to be resolved in the field, and almost all blank areas in the state were filled in by reconnaissance mapping by the California Division of Mines and Geology. Nevertheless, a few areas of complex geology, or where particularly detailed work was surrounded by less detailed mapping, white areas were left around the more detailed area to preserve as much information as possible. Blank areas marked on the atlas sheets as "unmapped" or "incomplete" amount to a very small percentage of some map sheets and are absent entirely from others.
1975 Fault Map of California, and 1977 Geologic Map of California
 Even before the 1:250,000 scale Geologic Atlas of California was completed, it was recognized that a smaller-scale map of the state, one that would present an overview of the geology of the entire state, was highly desirable. It had become apparent that the individual atlas sheets, as useful as they were for field and office purposes, were not satisfactory for evaluation of statewide geologic and structural trends. Therefore, late in 1965, plans were made for a smaller scale map of California (Jennings, 1965). After consideration of various scales, 1:750,000 was chosen because this scale is sufficiently large to show a significant amount of geologic information and also is consistent with the first two official geologic maps of California published by the State in 1891 and 1916. At the beginning of the project, it was decided that a multipurpose map of the state would be most desirable. In addition to the geology, the map would emphasize recently active faults, recent volcanic rocks and volcanoes, thermal springs, offshore structures, and major fold axes. Therefore, all these data were plotted on the work sheets; but it became evident that, for publication purposes, it would be much more effective to separate some of this information and make two maps rather than one. Pursuing this concept, it was planned to present a series of maps at the same 1:750,000 scale illustrating various geologic and geophysical parameters that can conveniently be studied individually or in relation to one another. Thus, the first map in this series was the Fault Map of California with Locations of Volcanoes, Thermal Springs and Thermal Wells, Geologic Data Map No. 1 (1975). This was followed by The Geologic Map of California, Geologic Data Map No. 2 (1977).
1994 Fault Activity Map of California and Adjacent Areas
New data concerning the age and activity of California faults necessitated a revision to the 1975 Fault Map of California. In 1990 Charles W. Jennings began compilation of new data and classification of Quaternary faults into a five age subdivisions (historic, Holocene, late Quaternary, undivided Quaternary, pre-Quaternary. This map took advantage of the extensive mapping of active faults for the Alquist-Priolo Earthquake Fault Zoning act. Age designations were also enhanced by the extensive work for Alquist-Priolo zoning: faults must be shown to have Holocene surface displacement to be included in “A-P” zones. Any fault evaluated and included in such a zone can be shown on the Fault Activity Map as Historic or Holocene. In addition, a more extensive explanatory text was keyed to numbers for many faults to allow geologists to look up the source of the original fault mapping and reason for the age classification.
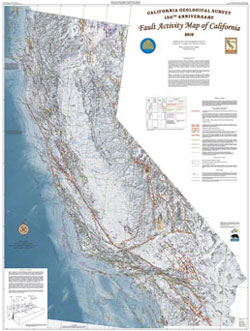
2010 Geologic Map of California and Fault Activity Map of California
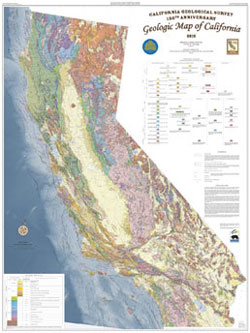 These editions of the Geologic Map of California and the Fault Activity Map of California were been prepared in recognition of the California Geological
Survey’s 150th Anniversary. Both are all-digital products built on the original compilations of C.W. Jennings published in 1977 and 1994. The digital version of the Jennings (1977) geologic map was released in 2000 (Saucedo and others, 2000) and serves as the base digital geologic data layer for the new geologic map with additions and modifications described below. The new editions remove, as much as possible, distortions in the previous digital versions that were inherited from the composite base map of the original printed versions.
These editions of the Geologic Map of California and the Fault Activity Map of California were been prepared in recognition of the California Geological
Survey’s 150th Anniversary. Both are all-digital products built on the original compilations of C.W. Jennings published in 1977 and 1994. The digital version of the Jennings (1977) geologic map was released in 2000 (Saucedo and others, 2000) and serves as the base digital geologic data layer for the new geologic map with additions and modifications described below. The new editions remove, as much as possible, distortions in the previous digital versions that were inherited from the composite base map of the original printed versions.
 The
2010 Fault Activity Map of California presents a much more detailed depiction of faults in California than previous versions. Faults active in the Quaternary (2.6 Ma) were digitized from their original sources in order to preserve as much of the original detail as possible. Similar to the 1994 Fault Activity Map, the new map is accompanied by an extensive listing of the sources of fault maps and age determinations. In the 2010 Fault Activity Map, the faults are depicted in as much detail as possible at the scale of the map. The
2010 Geologic Map of California includes modifications to the fault traces for consistency with the 2010 edition of the Fault Activity Map of California. Due to the complexity of the onshore geologic data depicted on the Geologic Map of California, it was not technically feasible to incorporate the detailed fault data in its entirety. A comparison of the datasets was made and numerous fault traces were replaced with simplified fault traces based on the new fault map. In addition, several faults that have been mapped since the compilation of the original geologic map were also identified and added, and traces no longer believed to be faults were removed. In general, the Quaternary faults shown in the onshore region of this map are intended to be a simplified representation of the faults depicted on the Fault Activity Map. Although the modification of faults in some areas necessitated the modification of bedrock geology adjacent to those faults, the distribution of bedrock geologic units compiled by Jennings (1977) has otherwise not been modified.
The
2010 Fault Activity Map of California presents a much more detailed depiction of faults in California than previous versions. Faults active in the Quaternary (2.6 Ma) were digitized from their original sources in order to preserve as much of the original detail as possible. Similar to the 1994 Fault Activity Map, the new map is accompanied by an extensive listing of the sources of fault maps and age determinations. In the 2010 Fault Activity Map, the faults are depicted in as much detail as possible at the scale of the map. The
2010 Geologic Map of California includes modifications to the fault traces for consistency with the 2010 edition of the Fault Activity Map of California. Due to the complexity of the onshore geologic data depicted on the Geologic Map of California, it was not technically feasible to incorporate the detailed fault data in its entirety. A comparison of the datasets was made and numerous fault traces were replaced with simplified fault traces based on the new fault map. In addition, several faults that have been mapped since the compilation of the original geologic map were also identified and added, and traces no longer believed to be faults were removed. In general, the Quaternary faults shown in the onshore region of this map are intended to be a simplified representation of the faults depicted on the Fault Activity Map. Although the modification of faults in some areas necessitated the modification of bedrock geology adjacent to those faults, the distribution of bedrock geologic units compiled by Jennings (1977) has otherwise not been modified.
Jennings (1977) simplified the depiction of Quaternary geologic units on the original map. As he put it: “various surficial deposits of Quaternary age are lumped into the unit ‘Q’.” Since Jennings’ work, subdivisions of these deposits have been found to have very different potential for liquefaction and for amplification of seismic shaking. Relative age of Quaternary alluvial fan deposits have also been found to correlate with potential for flooding. Since these units are important for evaluation of geologic hazards, the 2010 update of the geologic map includes a subdivision of Jennings “Q” into younger alluvium “Q” and older alluvium “Qoa”. In general, younger alluvium was deposited in Holocene time and represents the modern deposition in flood plains and on alluvial fans. Older alluvium is generally of Pleistocene age and represents depositional systems that are not currently active.
References
Blake, W.P., 1857, Geological report, in Williamson, R.S., Report of explorations in California for railroad routes (from Mississippi River to the Pacific Ocean) 1853 [Senate Ex. Doc. no. 78], v. 5, pt. 2, 310p.
Guillemin-Tarayre, Edmond, 1871, Description des anciennes possessions mexicaines du nord: Paris, France, Mission Sci. au Mexique et dans I'Amerique Centrale, Geologie, pt. 2, 216 p.
Ireland, William, Jr., 1890, Report of the State Mineralogist: California State Mining Bureau tenth annual report, 983 p.
Jahns, R.H., 1961, Geologic Map of California, Olaf P. Jenkins edition: Economic Geology, v. 56, no. 6, p. 1154-1156.
Jennings, C.W., 1965, 1:750,000 geologic map project: Memo to lan Campbell, Chief California Division Mines and Geology, December 30, 1965, 8 p.
Jennings, C.W., 1975, Fault map of California with location of volcanoes, thermal springs, and thermal wells:California Division of Mines and Geology Geologic Data Map No. 1, scale 1:750,000.
Jennings, C.W., 1977, Geologic Map of California:California Division of Mines and Geology Geologic Data Map No. 2, scale 1:750,000.
Marcou, Jules, 1883, Note sur la geologie de la Californie: Soc. Geol. France Bull., 3d ser., v. 11, p. 407-435.
Smith, J.P., 1916, The geologic formations of California with reconnaissance geologic map: California State Mining Bureau Bulletin No. 72, 47 p.
