Calculations of earthquake shaking hazard for California are part of a cooperative project between the USGS and CGS, and are part of the
National Seismic Hazard Maps. Earthquake shaking hazards are calculated by projecting earthquake rates based on earthquake history and fault slip rates, the same data used for calculating earthquake probabilities. Fault parameters are developed for these calculations by the Working Group on California Earthquake Probabilities.
Probabilistic Seismic Hazard Map
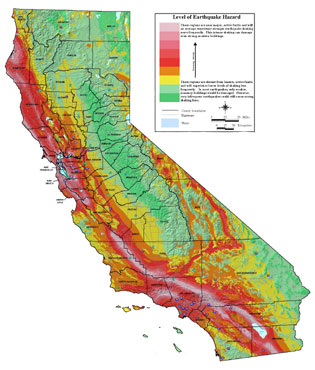
A probabilistic seismic hazard map is a map that shows the hazard from earthquakes that geologists and seismologists agree could occur in California. It is probabilistic in the sense that the analysis takes into consideration the uncertainties in the size and location of earthquakes and the resulting ground motions that can affect a particular site.
The maps are typically expressed in terms of probability of exceeding a certain ground motion. For example, the 10% probability of exceedance in 50 years maps depict an annual probability of 1 in 475 of being exceeded each year. This level of ground shaking has been used for designing buildings in high seismic areas. The maps for 10% probability of exceedance in 50 years show ground motions that we do not think will be exceeded in the next 50 years. In fact, there is a 90% chance that these ground motions will NOT be exceeded. This probability level allows engineers to design buildings for larger ground motions than what we think will occur during a 50-year interval, which will make buildings safer than if they were only designed for the ground motions that we expect to occur in the next 50 years.
CGS Map Sheet 48 shows potential seismic shaking based on National Seismic Hazard Map calculations plus amplification of seismic shaking due to the near surface soils.
Seismic Sources
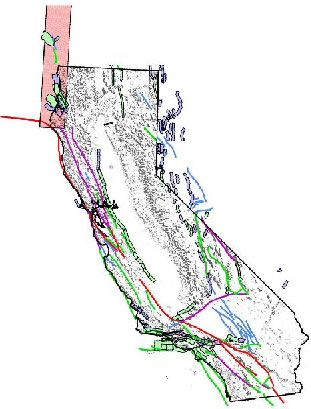 Probabilistic seismic hazard models consider earthquakes on faults and in background sources (random earthquakes). The activity rates for earthquakes along faults are related to the slip rate (how fast one side of a fault slides past the other side). In the seismic source model, the faster a fault slips the more likely the fault is to generate earthquakes. The length or area of fault rupture is used to determine an expected magnitude for the fault. This is an important factor since larger earthquakes occur much less frequently and tend to use up more stored energy (moment) than smaller earthquakes. Fault points used for the development of the seismic source model can be downloaded through a license agreement.
The earthquake catalog for magnitudes greater than 4 are used to describe where future large earthquakes may occur. We recognize that we have not included all faults in this analysis that could generate an earthquake. Therefore, we use a random background earthquake component that accounts for these sources that have not been included in the model. The catalog of earthquakes that we used can be downloaded through a license agreement.
Ground Motions
Ground motion is determined from attenuation relations that relate the magnitude and distance from the site to the rupture. Typically ground motions tend to attenuate (or become smaller) as the waves travel away from the source. There are exceptions to this rule. For example, a wave may be amplified by soft sediments or by a deep basin.
 Historical earthquake records of ground shaking have been used to generate mathematical attenuation relations that describe how the ground motions attenuate with distance and for different sizes of earthquakes and different styles of faulting. Several different attenuation relations are used to generate the ground motions in the seismic hazard analysis. For our analysis we have used attenuation relations by Boore et al. (1997), Sadigh et al. (1997), Abrahamson and Silva (1997), Campbell and Bozorgnia (2003), and Spudich et al. (1999). All of these attenuation relations may be found in Seismological Research Letters, Volume 68, Number 1, January/February, 1997.
Hazard Curve
Hazard curves show the probability of exceeding different ground motion values at a site. For example, the 10% probability of exceedance in 50 years is one point on a hazard curve. Hazard curves are important for comparing the hazard at different sites. Some sites may have a high probability of exceeding small ground motions, but a very small probability of exceeding large ground motions. These curves are important for understanding the types of ground motions that one can expect to exceed at a site. Also the hazard curve is important for determining the expected losses. Losses can be caused by freqent smaller events or from less freqent large events. An example of a hazard curve is shown below.