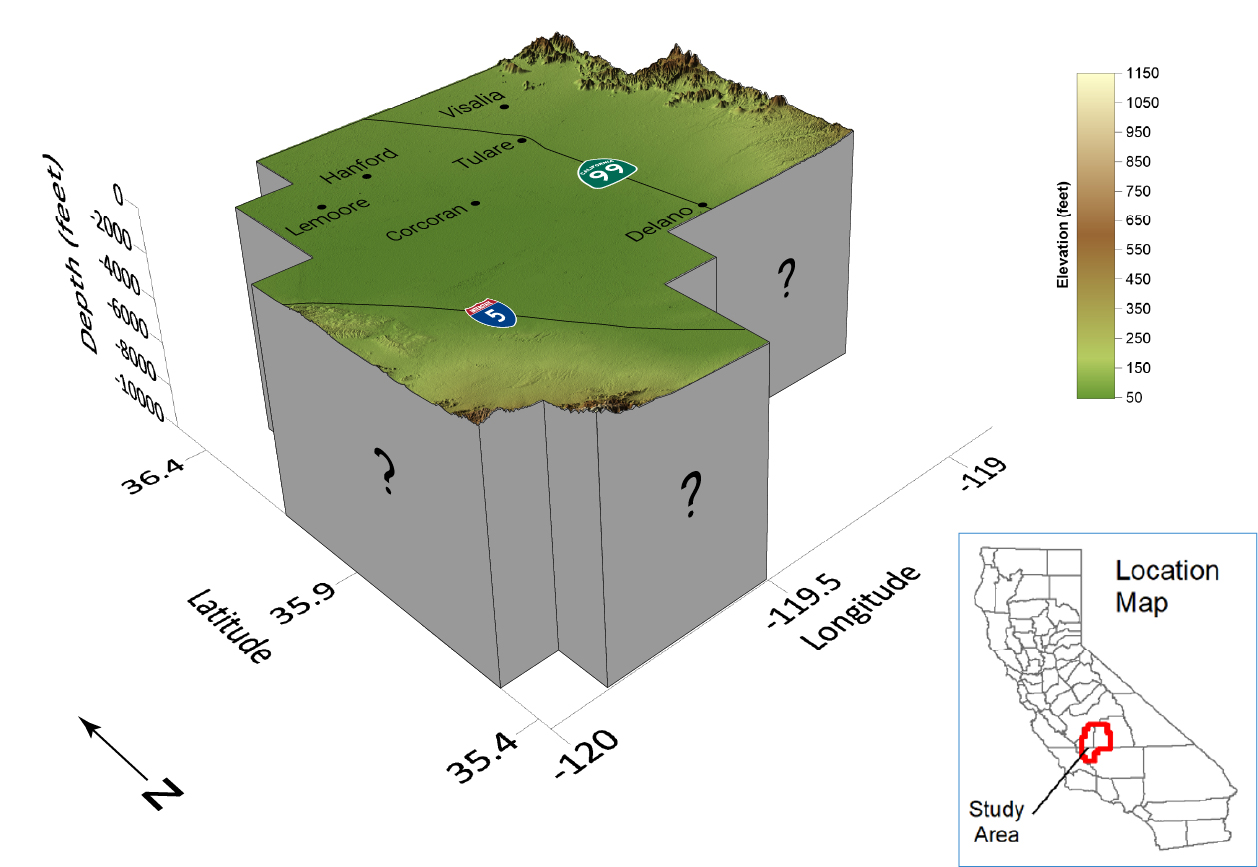
 Figure 1. 3D geological modeling oblique block diagram of the southern San Joaquin basin pilot project. Vertical exaggeration in this image is 5 times normal. Click/tap image to open a high-resolution version.
Project Description
The Southern San Joaquin Basin 3D Geo project covers an area of approximately 3,600 square miles (9,300 km2) in California's San Joaquin Valley (SJV) (Figures 1, 2, and 3), where more than 140 linear miles (225 km) of state and federal infrastructure provides water for drinking and agriculture. The southern SJV is a region of significant agricultural and energy production that is experiencing a number of issues: critically low groundwater supply from overpumping, land subsidence impacting surface infrastructure (largely due to groundwater overdraft), and impairments to groundwater quality from industrial sources. This region has the potential for significant and impactful geologic carbon sequestration and sustainable groundwater development. Critical infrastructure and a growing population in the southern SJV are also subject to seismic hazards.
This project will produce a regional block model of geologic formations with updated 3D fault mapping, including focused models of notable aquifers and potential carbon storage reservoirs, and a web map with searchable and downloadable data products on the online California Natural Resources Agency Open Data, CGS, and DOCMaps portals. The results of this three-year pilot project will be used to develop a long-term strategy and prioritization of similar efforts across California, including projects that have the greatest potential to meet the state's groundwater and carbon goals. For example, sustainable groundwater management and flood-managed aquifer recharge (flood-MAR) projects and initiatives conducted by the California Department of Water Resources (DWR) and Groundwater Sustainability Agencies (GSAs) will be well-supported and likely enhanced by the 3D Geo project's data products. Thus, the short-term objectives of this project, if met, provide a critical step toward a long-term goal of serving public health, safety, and economic welfare.
Project Area Maps
 Figure 2. Project area map. Inset A shows InSAR-derived subsidence from June 2015 through October 2020. Inset B shows shaking intensity probability for a 2,475-year return period in percent of g (gravitational acceleration at sea level), with a peak of 1.65 g in the project area. Click/tap image to open a high-resolution version. Sources: Subsidence data from DWR/TRE Altamira; groundwater basin boundaries from CA DWR Bulletin 118.
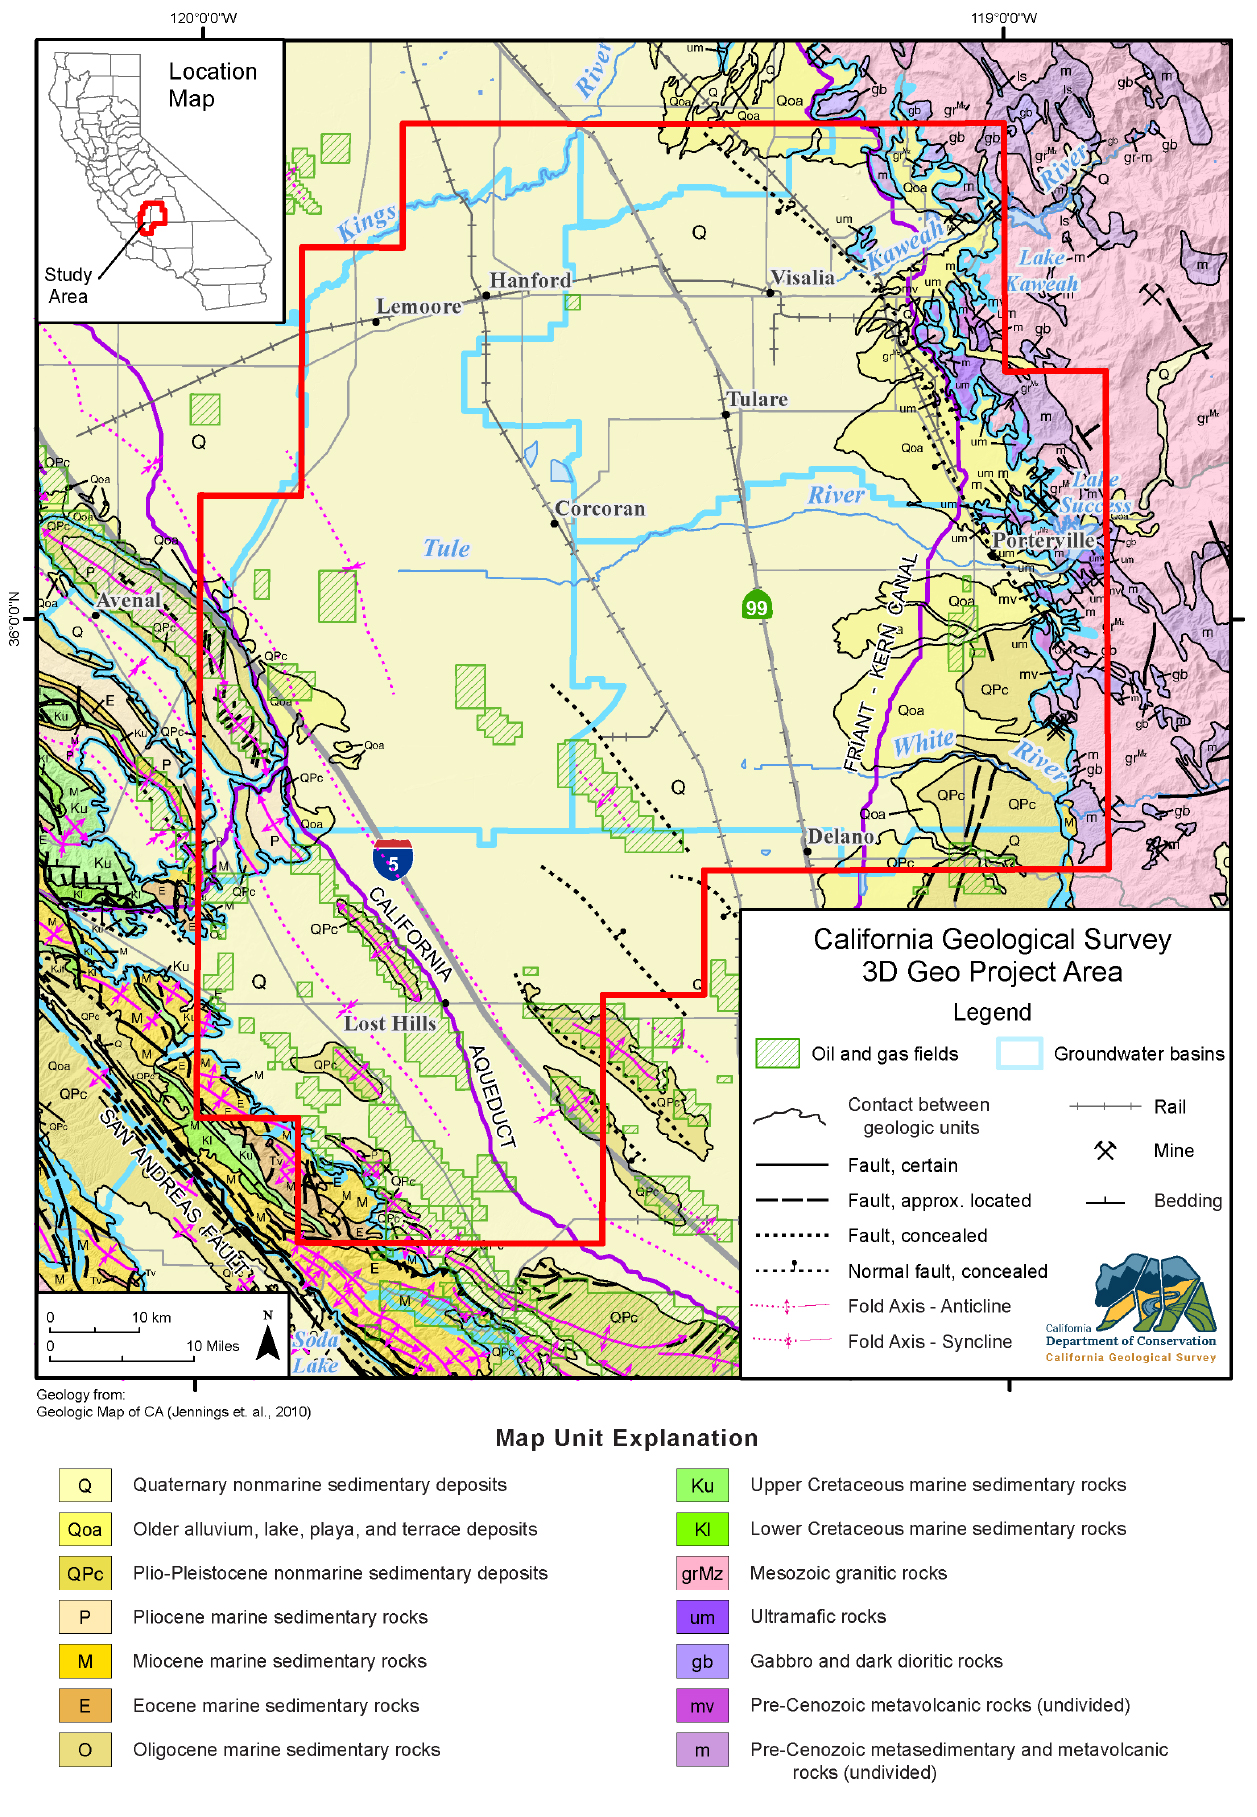 Figure 3. Basic geology of the project area. Click/tap image to open a high-resolution version. Source: CGS GDM 2, 2010.
Groundwater Sustainability Agencies in the Project Area
Project Partners and Stakeholders
Project Contact
Web page by:
California Geological Survey - Regional Geologic and Landslide Mapping Program
Last modified: 6/3/2025
