How an earthquake in Japan helped shape California's plan for the next tsunami
On March 11, 2011, a magnitude M9.1 subduction zone megathrust earthquake occurred offshore of eastern Japan. Over a period of several minutes, the fault slipped more than 50 meters (165 feet) causing strong ground shaking and triggering landslides, liquefaction, and tsunami waves. This page presents a scientific perspective of the 2011 Tōhoku-oki Earthquake and Tsunami, including details of what happened in Japan and subsequently in California. The west coast of the U.S. will experience damaging tsunamis in the future and the Tōhoku-oki natural disaster provided valuable lessons that are being used to help us be more resilient to the next event.
The Earthquake
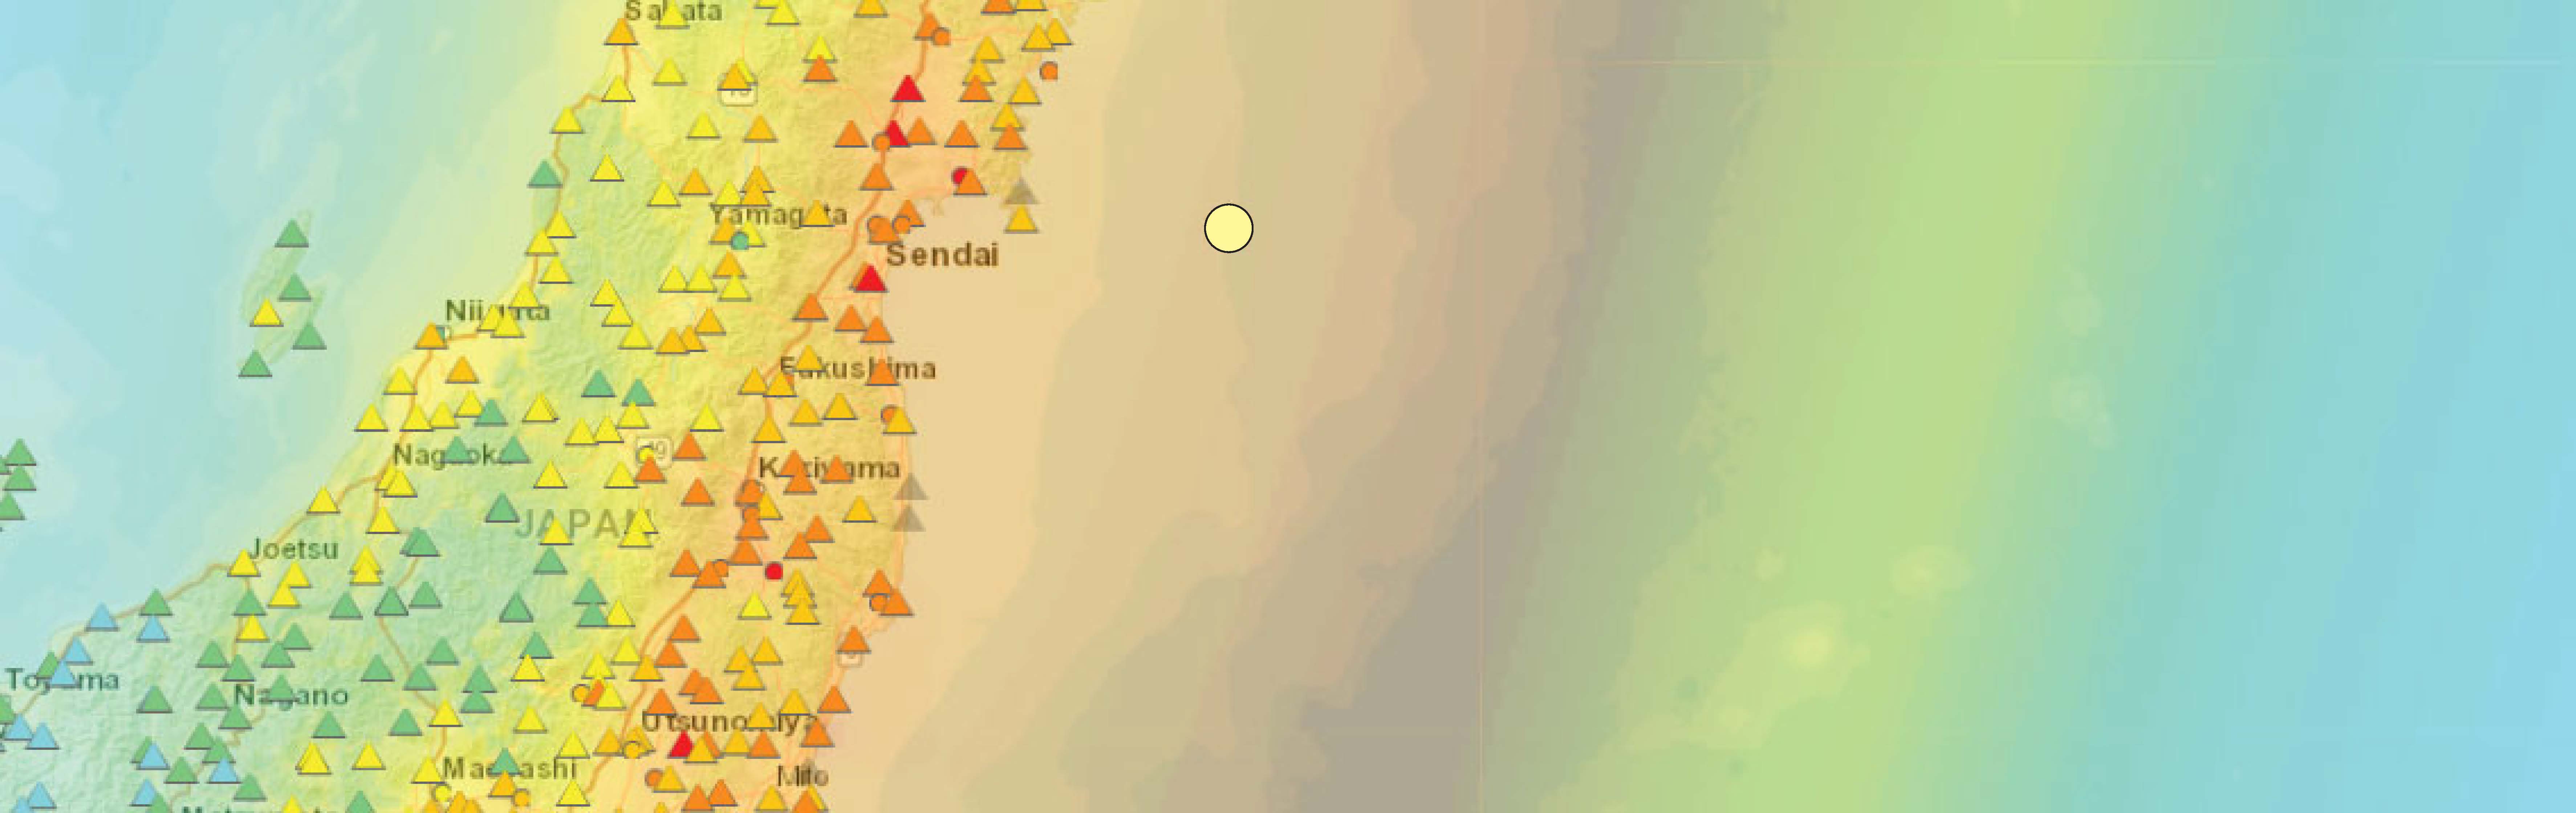
The image above is a “shake map” that shows earthquake intensity in different colors. Read more about earthquake intensity below.
Earthquake Intensity
Earthquake intensity is a measure of how strongly earthquake shaking is felt by people and objects. The further away from the epicenter, the lower the earthquake intensity. Seismologists use computer models to estimate what the intensity will be from an earthquake and these data are plotted on maps using the Modified Mercalli Intensity Scale. The U.S. Geological Survey uses its “Did You Feel It?” system to collect observations about how strongly people in different places felt an earthquake.
Explore the map to see the level of intensity people felt in different parts of Japan. The map displays the USGS intensity model for the M9.1 earthquake as transparent colors. The map also shows, as colored circles, the “Did You Feel It?” report results from people who experienced shaking from this earthquake. Open the map in a new window 
Seismicity
The 2011 Tōhoku-oki earthquake was caused by sudden movement in the subduction zone associated with the deep-sea Japan Trench. A subduction zone is a boundary between tectonic plates, specifically where oceanic and continental plates collide. The oceanic plate, being more dense than the continental plate, is forced beneath the continental plate. In the case of eastern Japan, the Japan Trench is formed by the subduction of the Pacific plate beneath the Okhotsk plate.
Explore the map to see the magnitudes of different earthquakes experienced by Japan. The map shows earthquake epicenters for large-magnitude historic events of the past century. It includes epicenters for all aftershocks and triggered earthquakes for a year after the M9.1 earthquake, and an outline of the aftershocks, which illustrates the area of the fault that slipped during the M9.1 earthquake. Open the map in a new window
Landslides and Liquefaction
Earthquakes can and do trigger landslides and liquefaction as seismic waves change the physical properties of materials as they travel through the Earth. The USGS uses computer models to estimate the chance that an area may have triggered landslides or induced liquefaction. The California Geological Survey uses similar models to delineate areas prone to ground failure and other earthquake related hazards as part of the Seismic Hazards Program
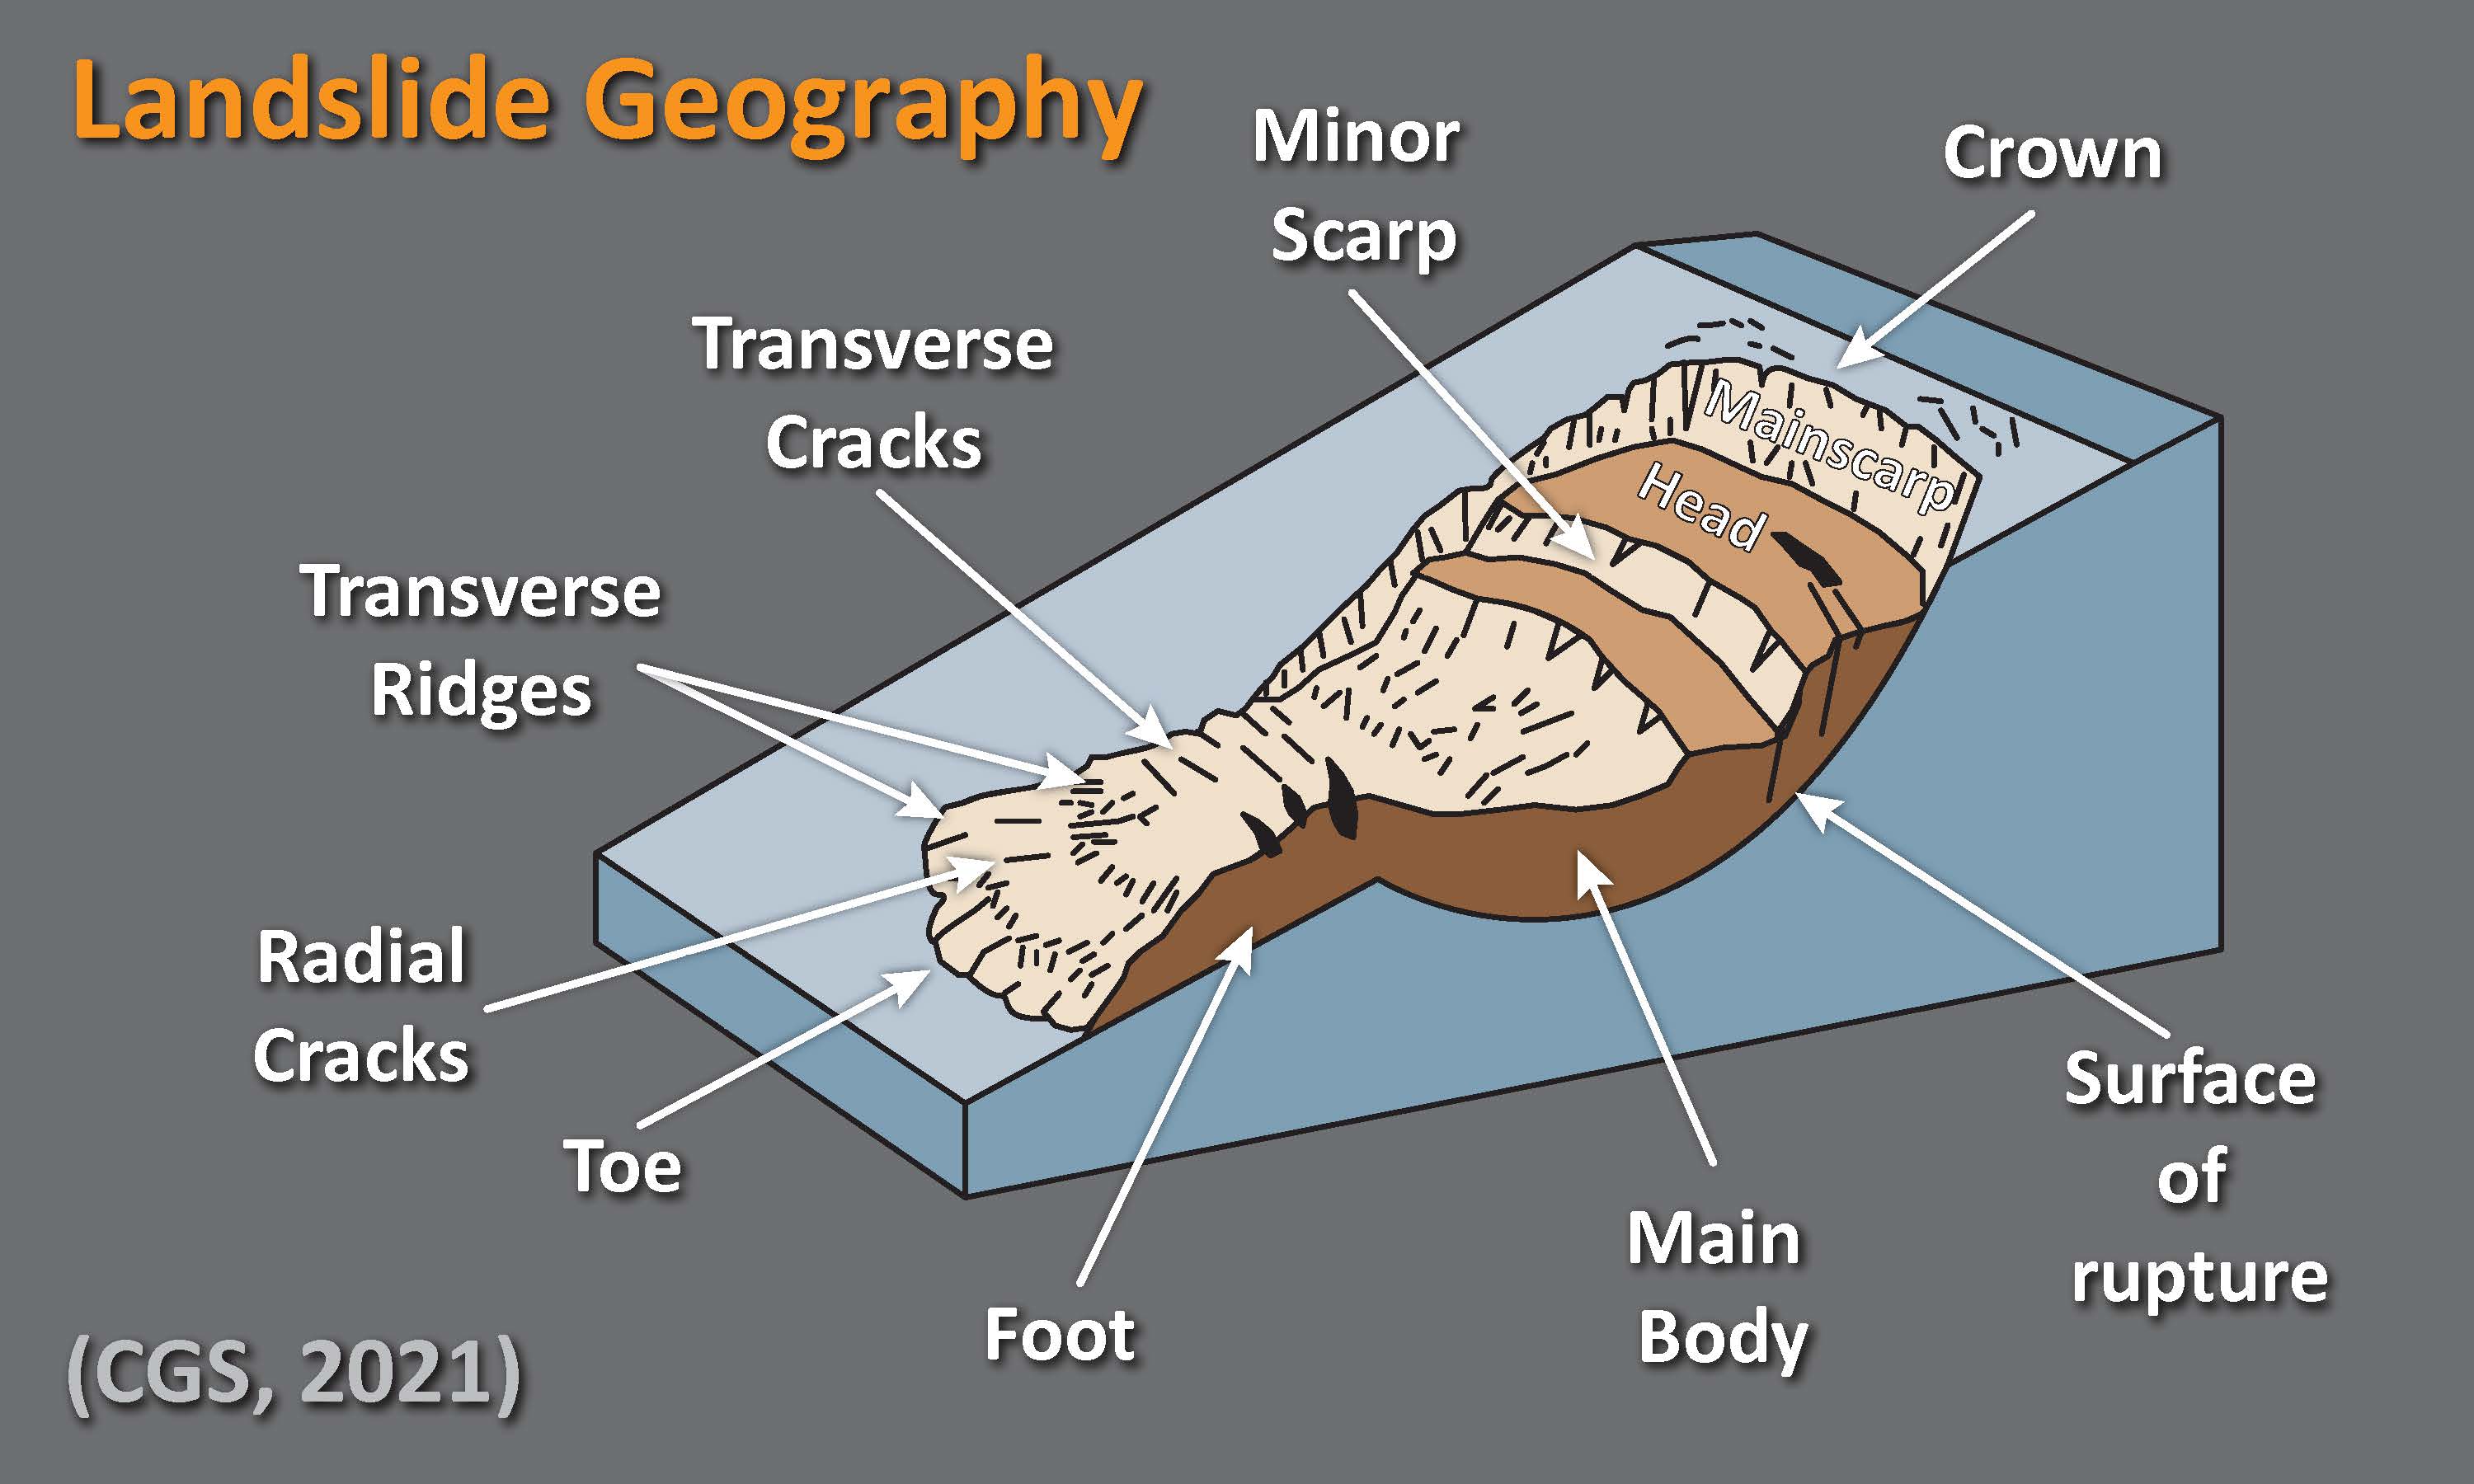
Landslides are caused when the strength of the hillslope materials is overcome by the forces from gravity and earthquake shaking. The illustration below is modified from the USGS landslide handbook.
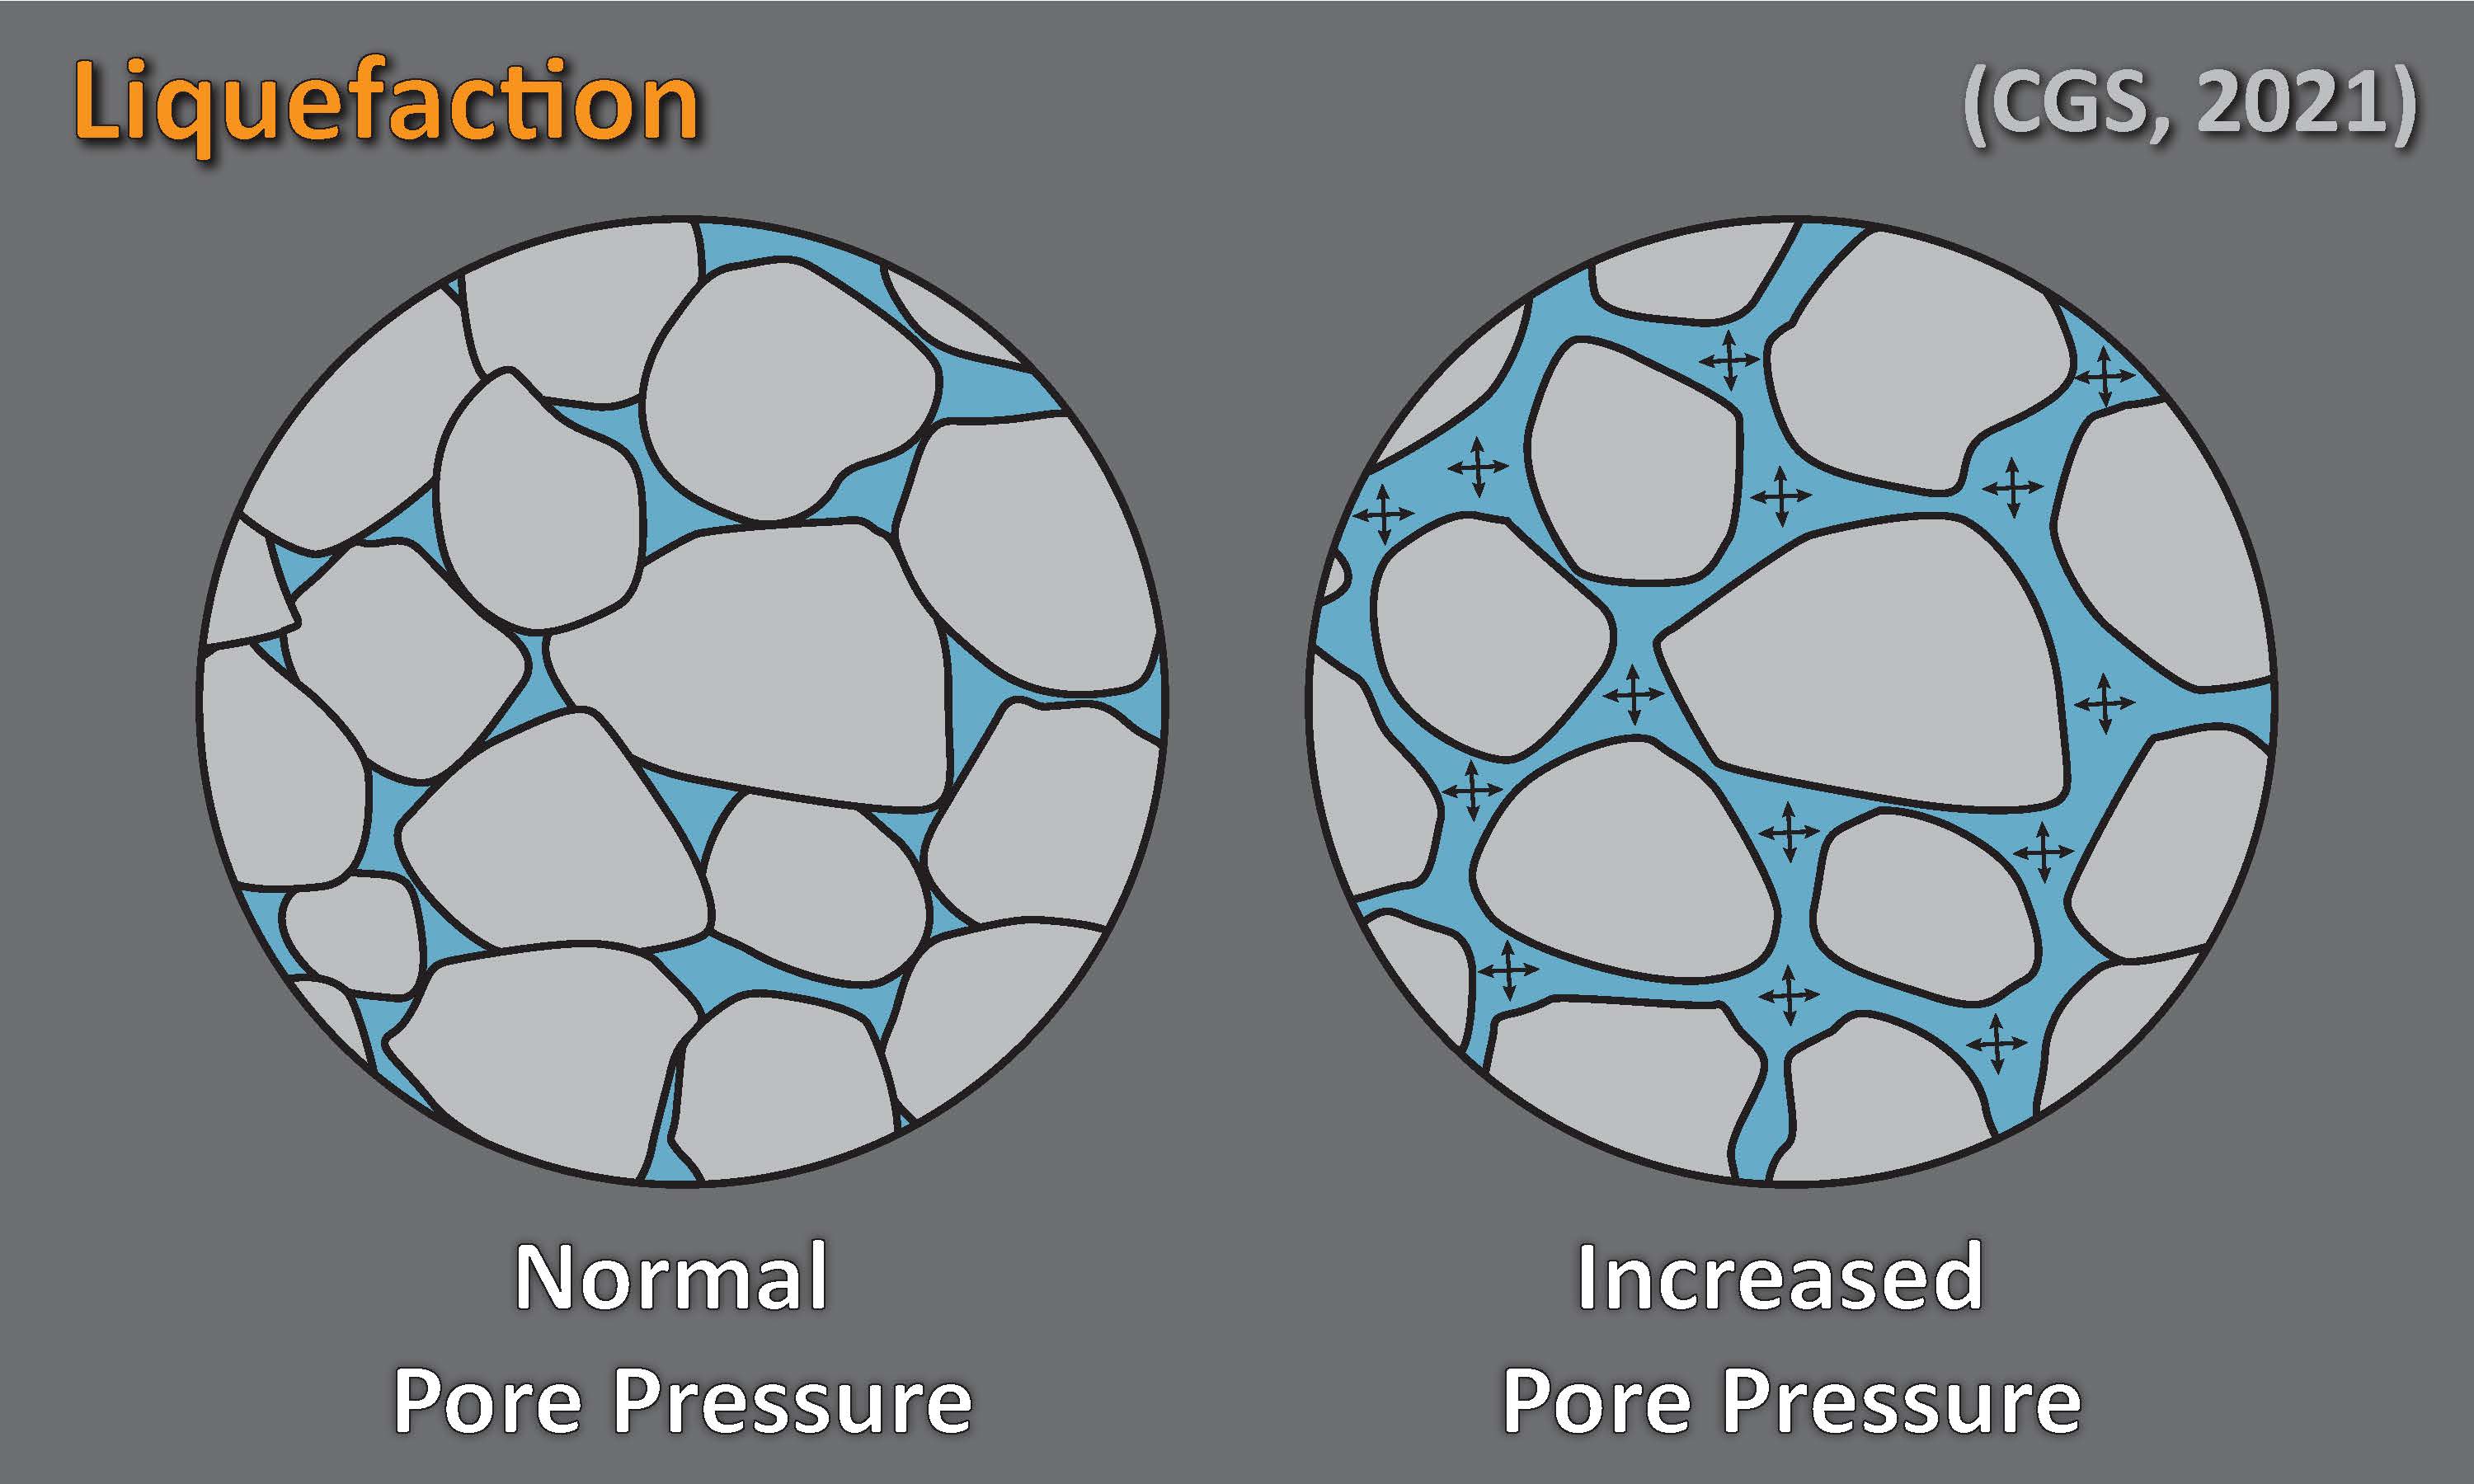
Liquefaction happens when there are changes in water pressure within the spaces (pores) between sediment particles. This is important because it temporarily turns the ground to mush, meaning the infrastructure on top isn't supported by solid ground and can fail.
The "swipe map" below shows the USGS model for the potential of earthquake triggered landslides on the left, and the chance for earthquake-induced liquefaction on the right. Open the map in a new window
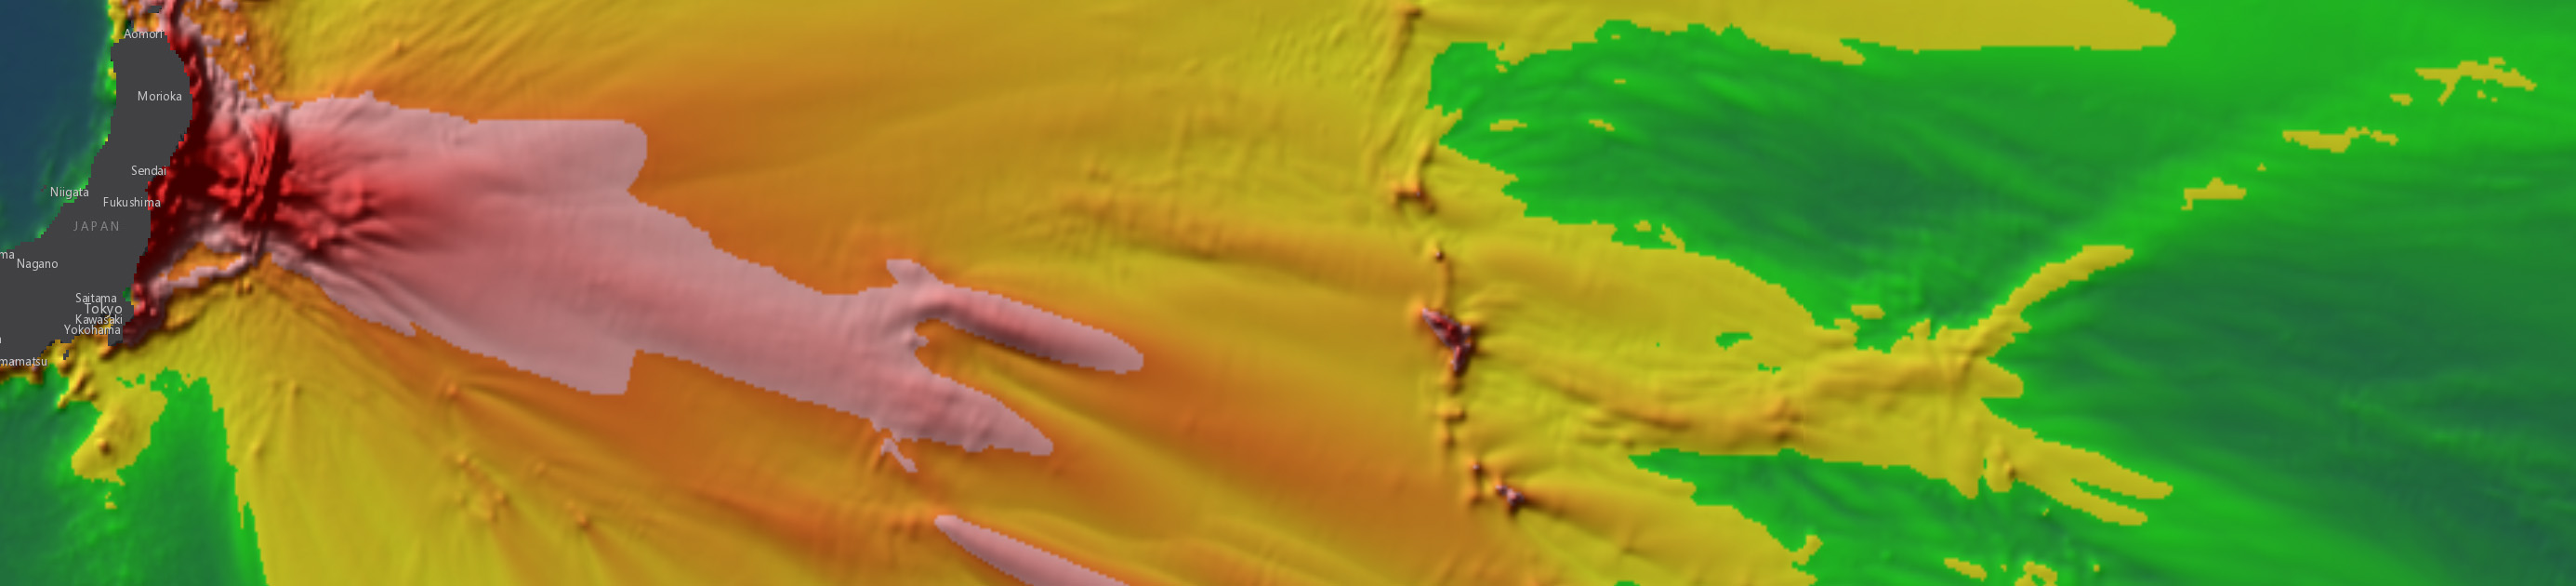
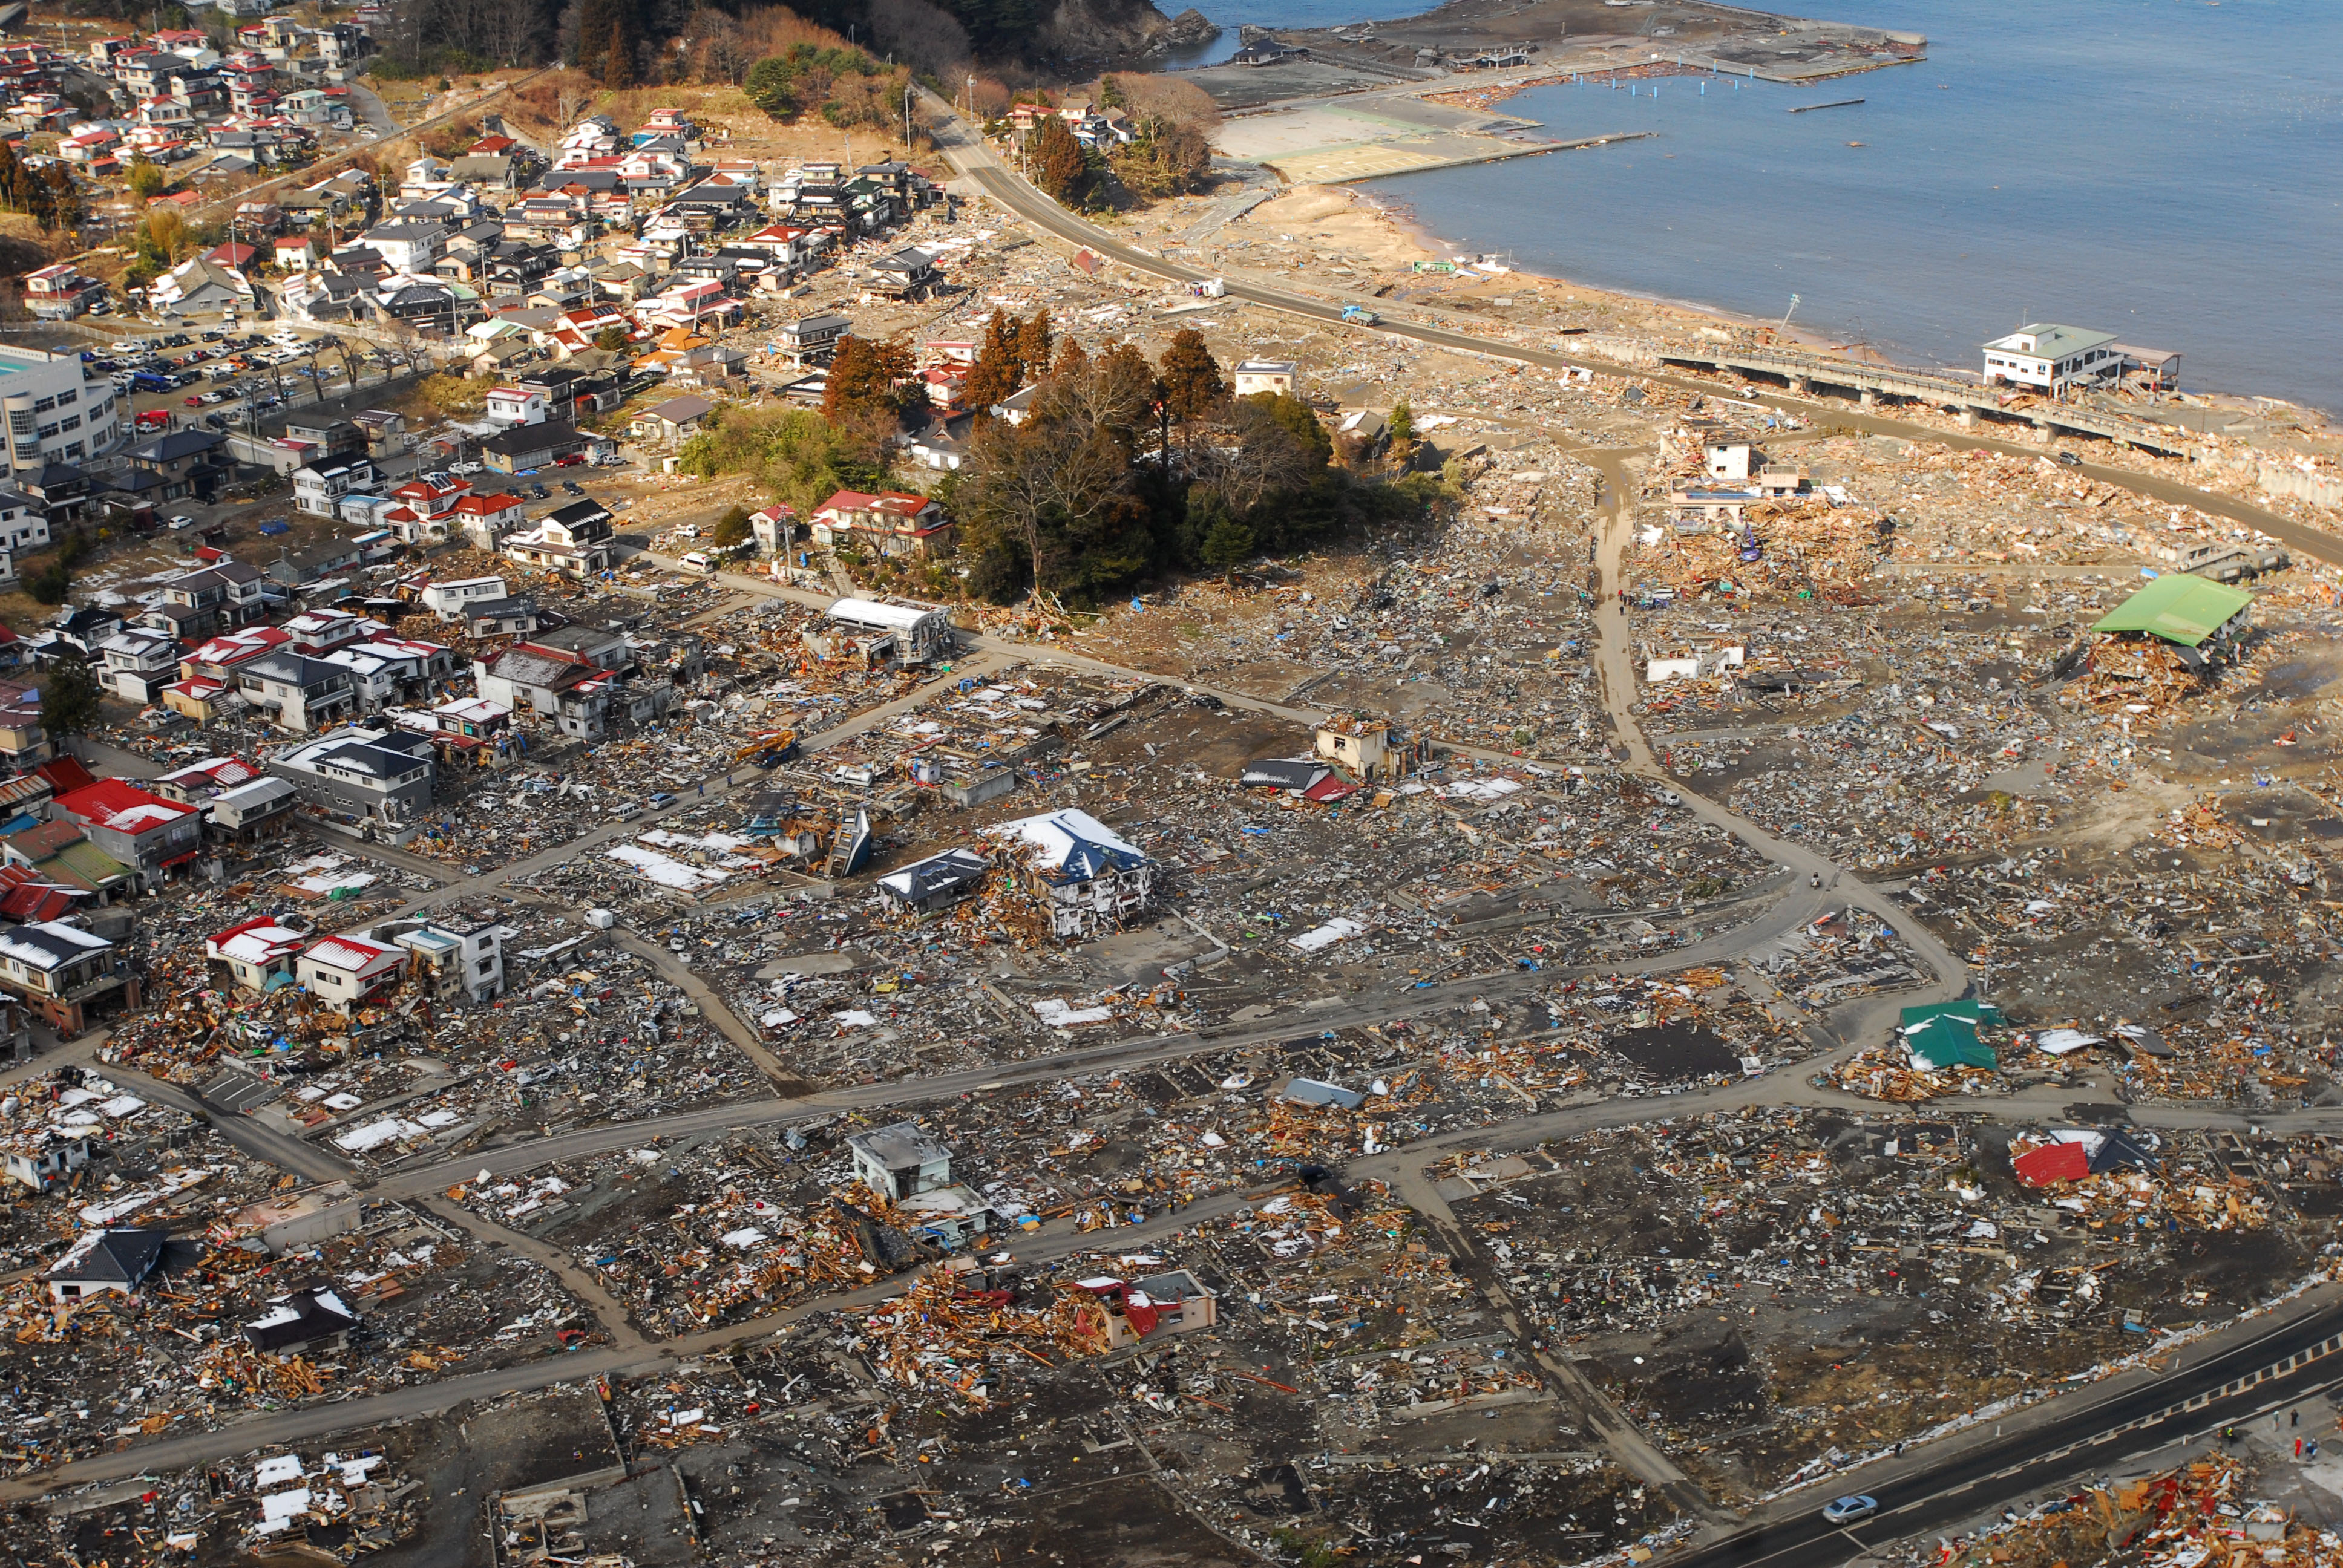
The Tsunami in Japan
The image above is a tsunami “energy map” that represents the maximum size of a tsunami using colors. The warmer colors represent larger tsunami waves.
Tsunami are typically caused by changes in the shape of the seafloor by earthquakes or landslides, though can also be caused by meteors or meteorological effects. During the M9.1 Tōhoku-oki earthquake, hundreds of square kilometers of seafloor were uplifted, displacing the overlying seawater. This displaced seawater generated large tsunami waves that radiated outwards away from the earthquake source. The waves traveled towards the coastline of Japan and across the Pacific Ocean significantly impacting coastal communities. Tsunami waves reached heights of almost 40 meters (130 feet) along the coast of Japan, causing more than 18,000 fatalities.
The interactive map below shows two sets of data: 1) tsunami size as recorded on tide gages and specially instrumented DART® buoys; and 2) tsunami size as observed by people during or after the tsunami. Select a colored bar on the map for more information about that location. Open the map in a new window
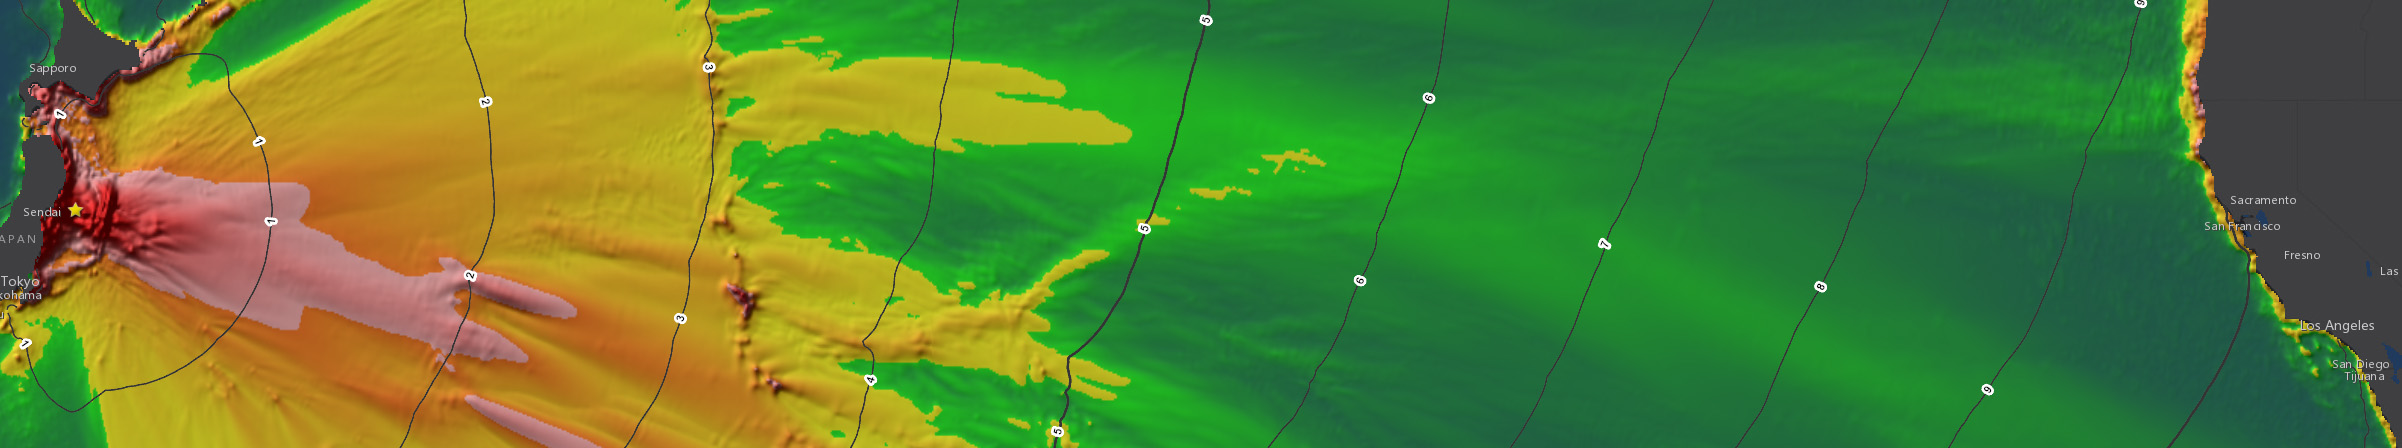
The Tsunami in California
The image above is from the same tsunami “energy map” shown in the previous section, with black lines showing the time that it takes for tsunami waves to travel across the Pacific Ocean. Note that it took between 9 and 11 hours for the 2011 Tōhoku tsunami to reach California.
Damage Summary
Tsunami waves originating near Japan traveled across the Pacific Ocean to impact many coastal communities in California 9 to 11 hours after the earthquake. In California, damage exceeded $100 million, primarily in coastal harbors and ports. Data about the waves, recorded by buoys and tide gages, helped federal, state, and local officials understand the incoming threat and determine the urgency level of notifications and the potential need for evacuations.
The accompanying table summarizes the Tōhoku tsunami effects at ten California coastal locations. For a more complete understanding of the tsunami's effects in California, download the expanded table of impacts, and explore the links in the Read More section at the end of this web page.
Tōhoku-oki tsunami forecasted and observed arrival times, tsunami amplitudes, and reported damage at ten California locations. Source: Wilson et al., 2013.
| Crescent City |
7:23 |
7:34 |
2.47 |
Near complete destruction of small boat harbor ($28M) |
| Klamath River |
|
|
|
One fatality (drowning) |
| Noyo River |
|
|
0.8-1.0 |
Major damage to docks/boats ($4M) |
| Oakland |
|
8:36 |
0.51 |
Minor damage at nearby Berkeley Marina |
| Santa Cruz |
|
|
1.6-1.9 |
Multiple docks destroyed, 14 boats sunk ($28M) |
| Moss Landing |
|
|
2 |
200 piles damaged ($1.8M) |
| Morro Bay |
|
8:00 |
1.6 |
Damage to several docks and boats ($500k) |
| Santa Barbara |
8:17 |
8:27 |
1.02 |
Damage to barges and boats ($70k) |
| Ventura |
|
|
1.3 |
Damage to dock and number of boats ($150k) |
| Mission Bay |
|
|
|
Dock destroyed, 13 boats damaged ($136k) |
Case Study – Crescent City
The most severe impact in the state occurred at Crescent City Harbor. Tsunami warnings initiated a full evacuation of the city’s tsunami hazard area on land and a mass departure of the fishing fleet from the harbor. Within the first two hours, tsunami amplitude peaked at 2.47 meters (8 feet). This happened at low tide, minimizing the extent of flooding on land, but dangerous surges and currents in the harbor lasted for more than 24 hours. All docks within the small-boat basin were heavily damaged or destroyed. Although dozens of boats made it out of Crescent City harbor prior to the tsunami, 16 boats sank and 47 others were damaged. Total damage to boats and infrastructure was approximately $28 million. Dredging and repairs to the harbor lasted well over a year.
Case Study – Santa Cruz
Approximately three hours after first tsunami arrival at Santa Cruz Harbor, several large, fast-moving tsunami bores surged to the far back of the harbor, causing dramatic buckling of docks where the harbor narrows. The overall long, rectangular shape of the harbor amplified the incoming surges, causing strong currents; tsunami observers estimated the current reached speeds between 14 and 15 knots. Though no tide gage exists within the harbor, video analysis indicates peak tsunami amplitudes between 1.5 and 2 meters (5 to 6.5 feet) in the harbor constrictions. Fourteen boats sank and many others were damaged. Twenty-three of the twenty-nine docks sustained significant damage, leading to about $28 million in damage. Repair work and dredging in the harbor lasted several months.
Tide Gage Records
NOAA (the National Oceanic and Atmospheric Administration) uses computer models to forecast what the sea level will be at specific locations based on the tides. If there was a tsunami or some other process that changes the water level, one may compare the forecast tide with the observed water level to see how large the tsunami was. For example, the image below is a tide gage record from Crescent City, California. In this example, the tsunami arrived at the Crescent City tide gage at 7:42am local time. The maximum tsunami amplitude was 2.21 meters and the maximum wave height was 3.81 meters. The data used to create this plot are available from NOAA.
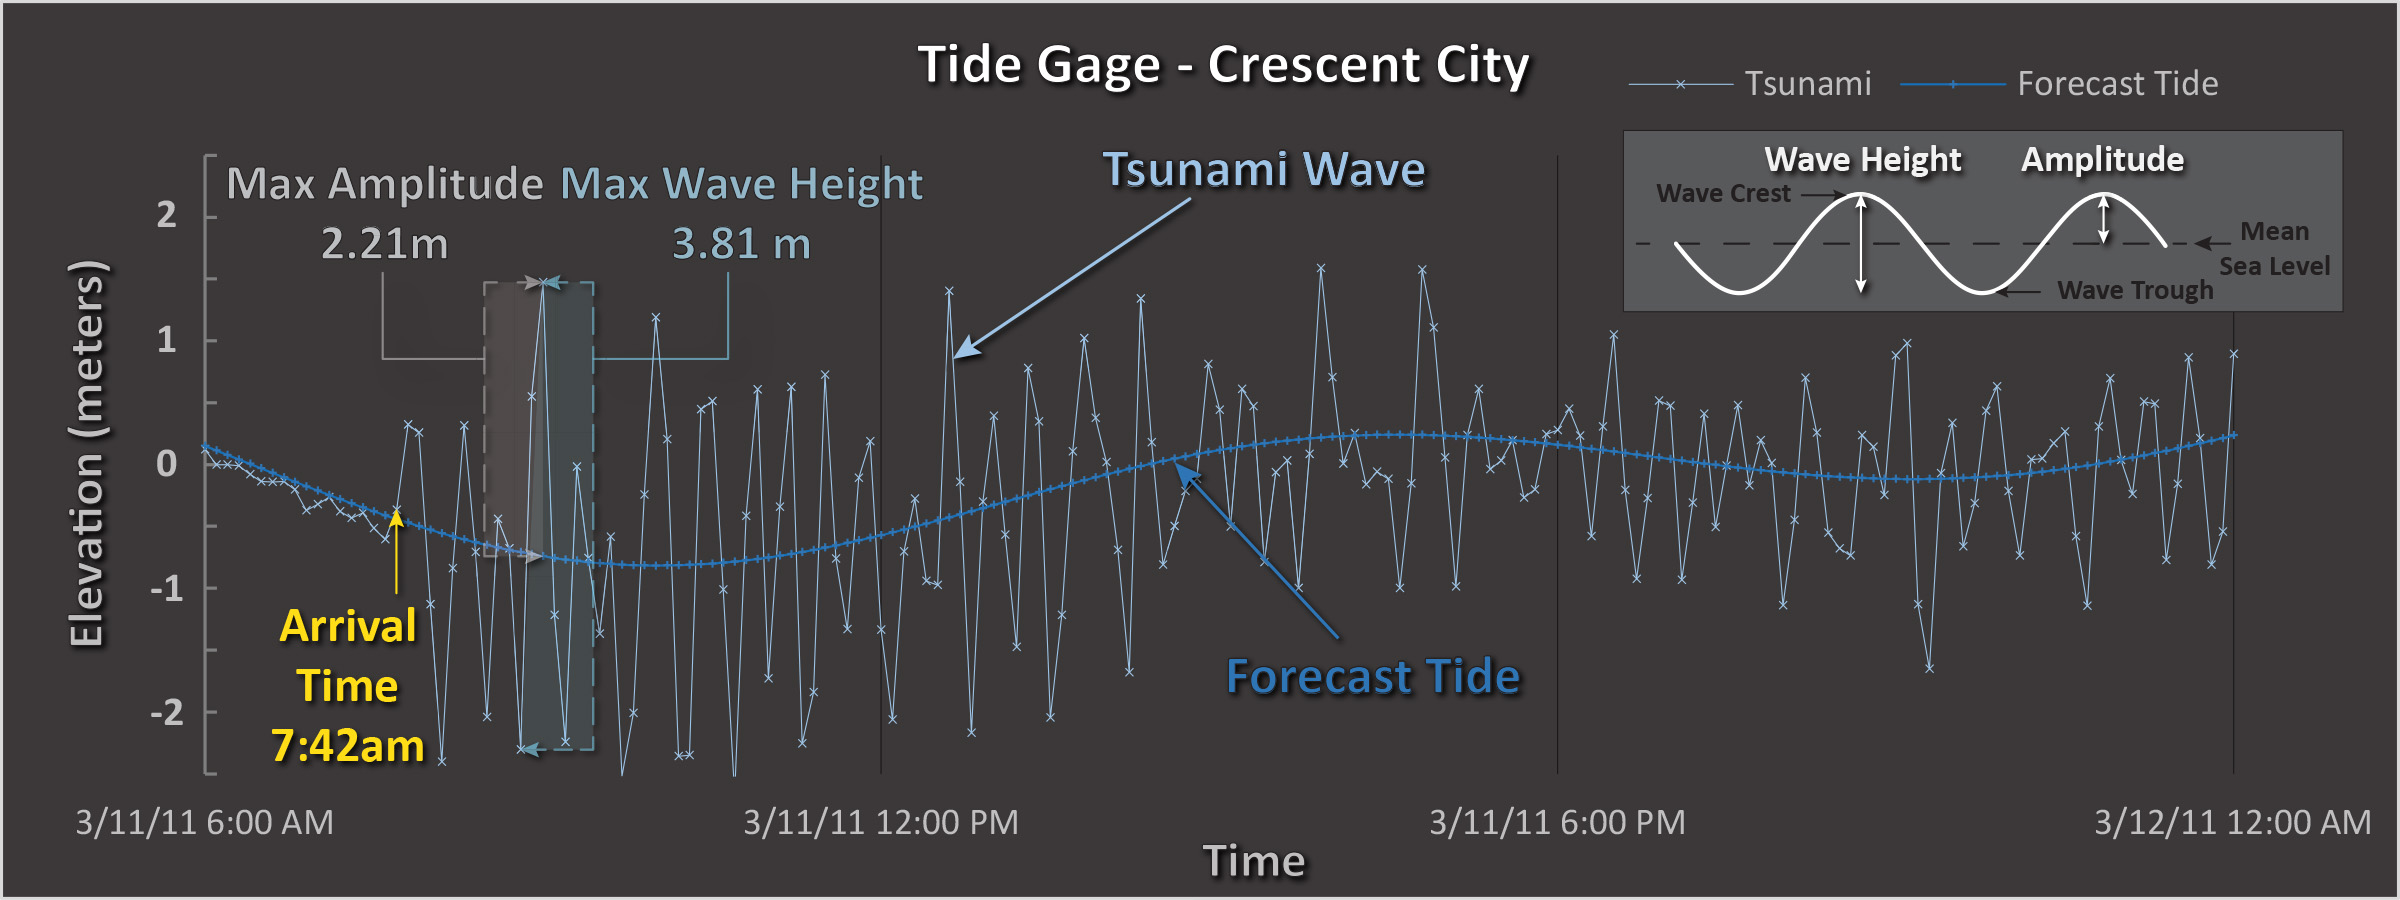 Example tide gage record - Time is represented by the horizontal axis and elevation is represented on the vertical axis. The darker blue line in this image represents NOAA's tidal forecast. The data recorded by the tide gage are represented by the light blue colored lines. Wave height is the distance measured between the wave crest and trough. Wave amplitude is the level of water above sea level.
The following map shows tsunami wave data as recorded by tide gages up and down the coast of California. Explore the map to see these records. Open the map in a new window

Trans-Pacific
Relationships
The image above is from the cover of the book ‘The Extraordinary Voyage of Kamome, A Tsunami Boat Comes Home.’ This image may inspire us to work together, to join forces, to build communities more resilient to natural disasters. Visit Kamome's web site to see the full image and to learn more about Kamome's story. (https://kamome.humboldt.edu/)
Following the tsunami in Japan, debris and material washed out to sea often traveled across the Pacific Ocean to the west coast of North America. One of these travelers was a boat that was found near Crescent City, California in April 2013. Dr. Lori Dengler, Troy Nicolini, and Vicki Osaki of the Redwood Coast Tsunami Work Group investigated this discovery. A little sleuthing by Dr. Dengler to locate the owners of the boat led to an enduring international relationship between now-sister cities Rikuzentakata, Japan and Crescent City.
The story was turned into a children’s book and video, which you can watch here.
Read More
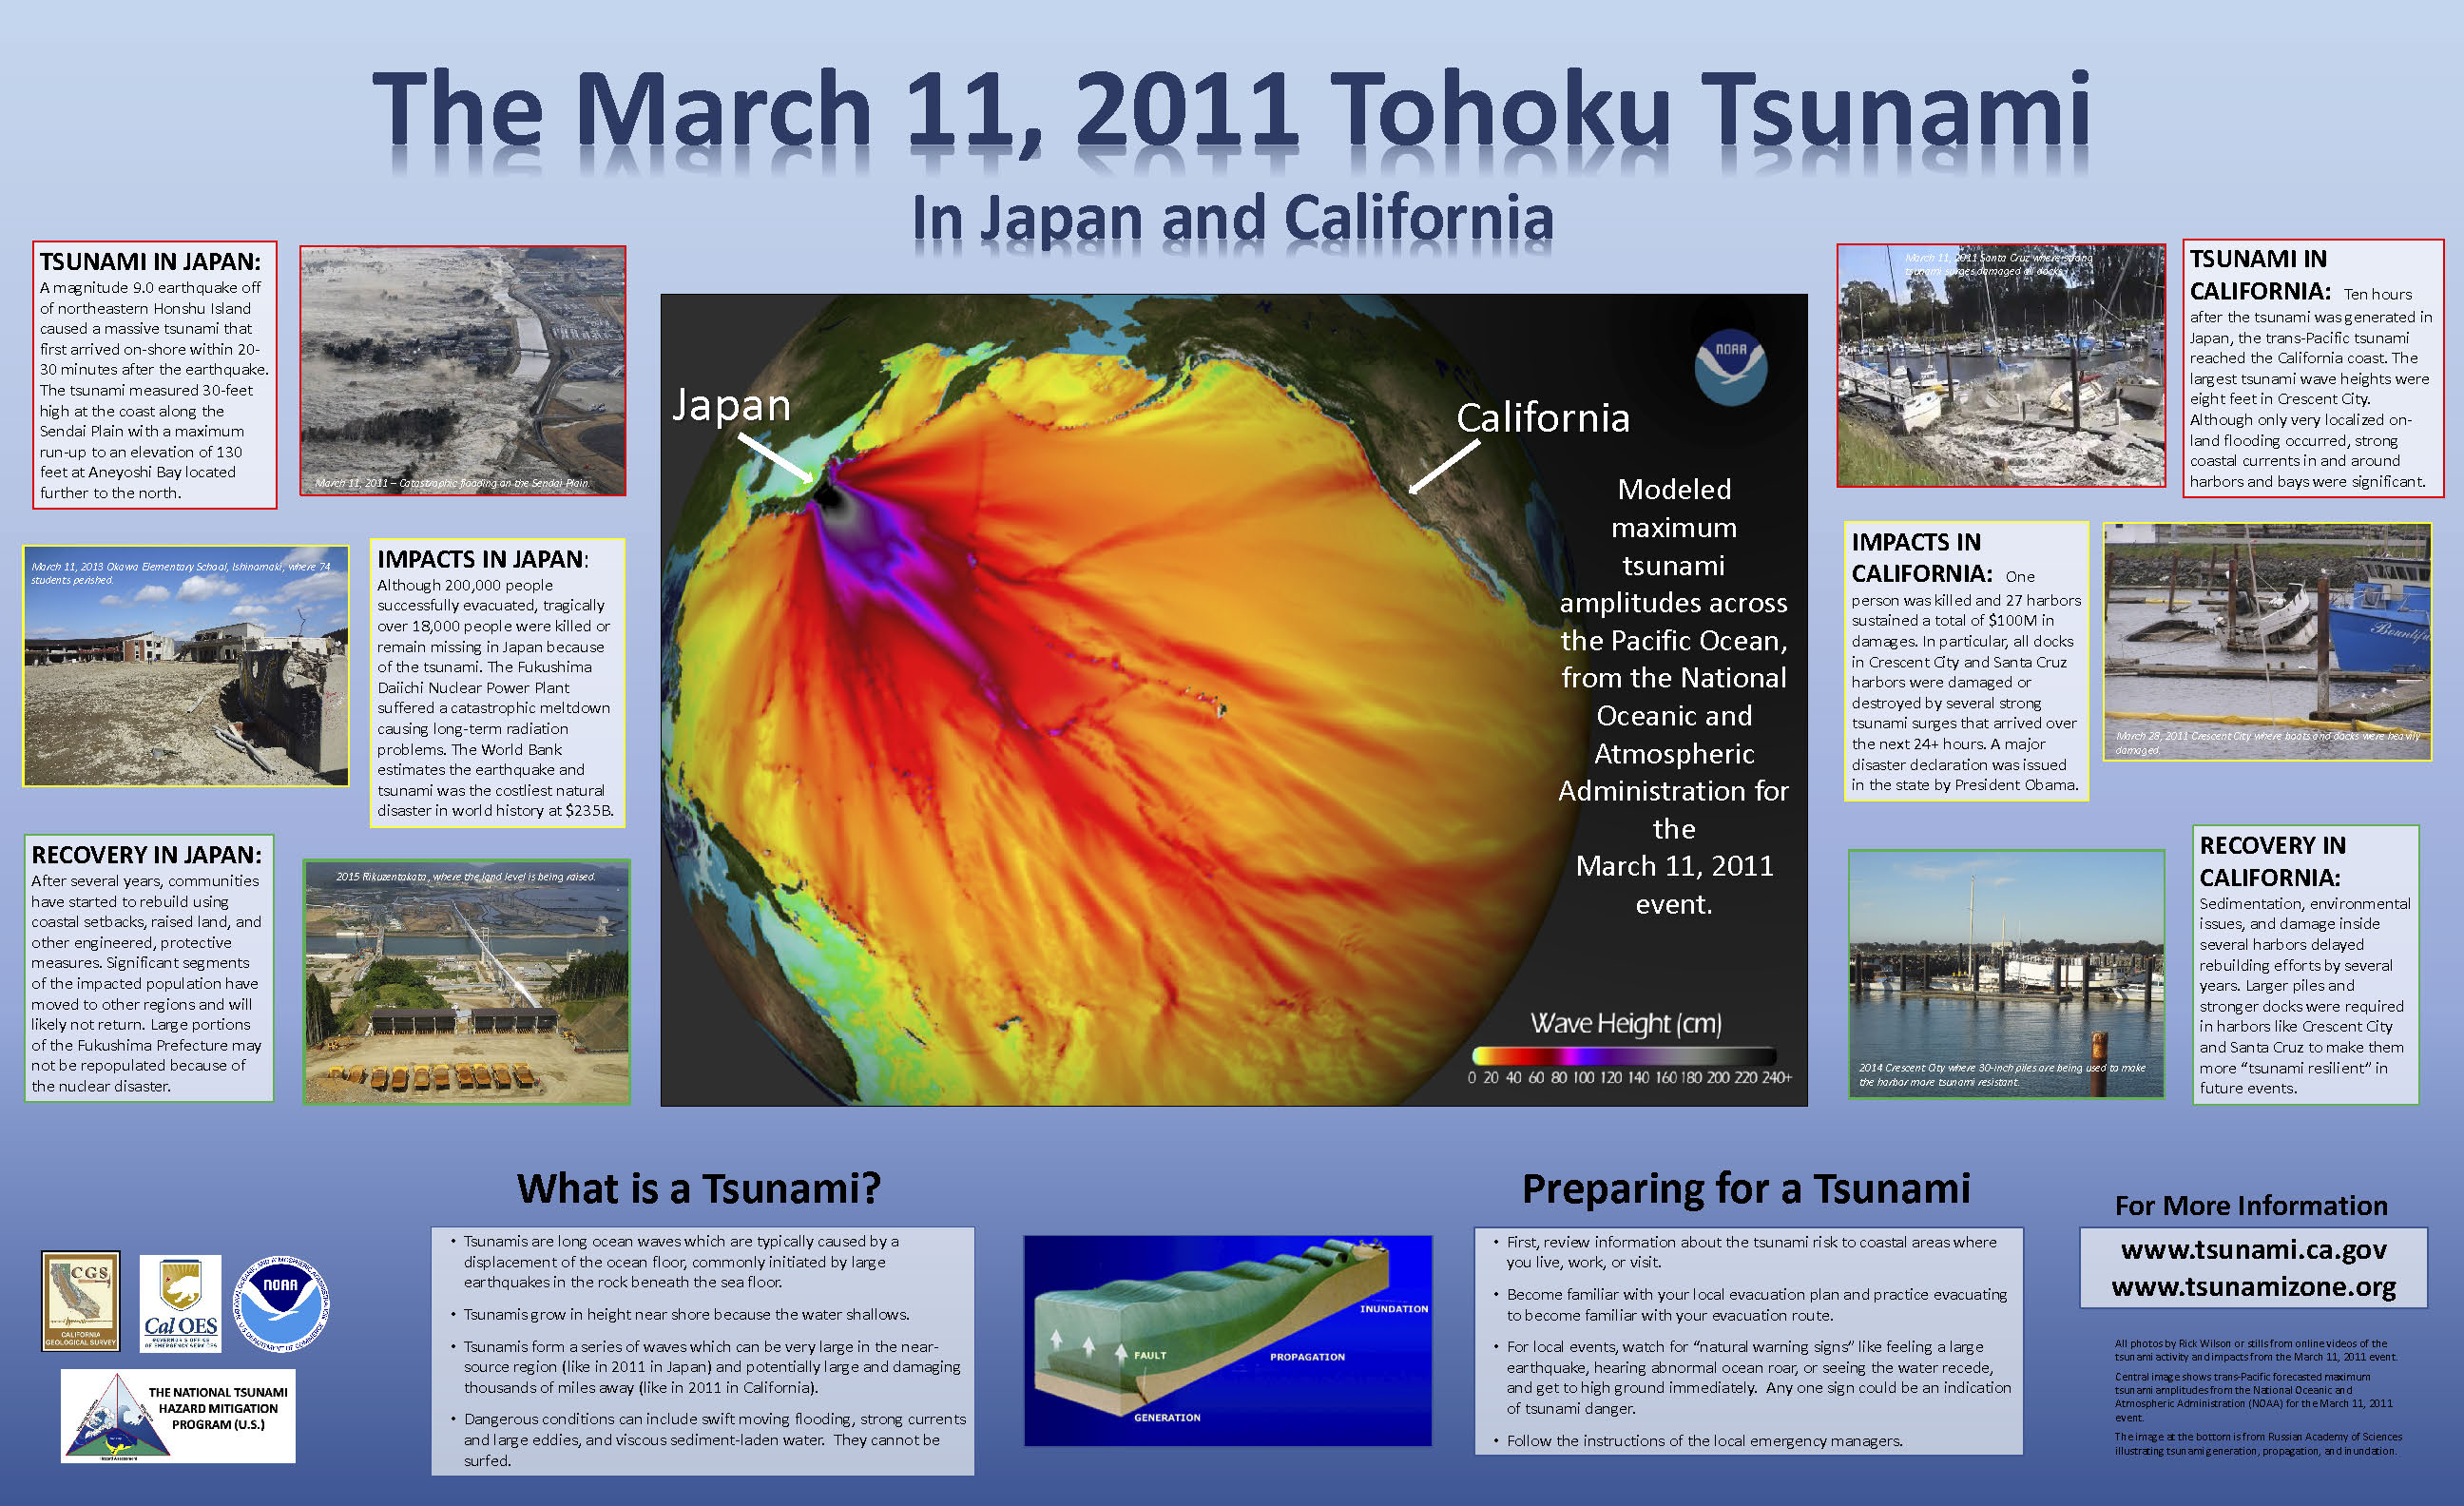
The California Geological Survey supports efforts to increase the state's resilience to tsunami hazards. Here is a poster dedicated to the impacts of the Tōhoku tsunami to the coast of California.
The California Geological Survey Tsunami Unit
When tsunamis or coastal flood events occur or are forecast to occur in California, the California Geological Survey Tsunami Unit deploys teams to make direct observations and collect perishable data. Following the Tōhoku tsunami, the CGS helped organize multi-organizational field teams to collect additional information about the extent and impact of the tsunami. This Coastal Flood Event Response also includes digital forms of data collection and web interfaces to share data in real time.
- Preparation: Tsunami Hazard Area Maps and Data
- Response: Tsunami and Coastal Flood Event Response Program
- Recovery: The CGS is working with partners to develop tsunami recovery and debris guidance documents for coastal communities.
- Mitigation: The CGS has prepared Harbor Improvement Reports so that maritime infrastructure can be designed with tsunami hazard mitigation in mind.
Contact the CGS Tsunami Unit
Back to the Tsunamis home page
Web page by:
California Geological Survey - Seismic Hazards Program
