During the early 1980s, under the provisions of Section 208 of the Federal Water Pollution Control Act, the Environmental Protection Agency (EPA) funded a number of water protection projects that involved the geologic mapping of sensitive watersheds along California’s north coast. Since then, the California Department of Conservation, California Geological Survey (CGS) has been contracted by the California Department of Forestry and Fire Protection (CDF) to produce maps for parts of Mendocino, Humboldt, and Del Norte counties, and other selected watersheds throughout the state (see Watersheds Map).
The long-range goals of the watersheds mapping projects are: 1) to retain productive forest soils, reduce sedimentation of north coast streams, and protect fish habitats; 2) to provide planning guides for timber harvesting and other forest management activities; 3) to comply with the 1983 Clean Water Goals of the Federal Water Pollution Control Act; and 4) to achieve the objectives in the state’s water quality control plans and other forest practice rules.
The maps provide essentially the same information for each of the watersheds studied. Physical characteristics that can be correlated to landslide potential, soil erosion potential and streambank erosion potential were mapped at a scale of 1:24,000. Sixty-eight 7.5-minute quadrangles were completed between 1981 and 1985. Additional mapping in selected watersheds identified by CDF includes interpretative evaluations of relative slope stability for long-term planning purposes.
Landslides
Four categories of active and dormant landslides are depicted on the maps. They include debris slides, translational/rotational slides, earthflows, and debris flows and torrent tracks. Debris slide amphitheater and slopes and inner gorges are not technically landslides, but features formed by landslides processes. These too are included on the watersheds maps. In some places, complex landsliding causes irregular ground surfaces that are indistinguishable or too small to map at the 1:24,000 scale. Such areas are depicted on the maps as disrupted ground or in those watersheds where relative slope stability maps exit, areas of extreme, high, moderate, and low relative stability are identified.
Use of the Maps
Watersheds maps are available to land managers, planners, and the public for uses aimed ultimately at the reduction of erosion and landsliding, and the enhancement of water quality.
The maps and legends will enable users to: 1) recognize and "flag" areas of potentially unstable ground, and 2) foresee and minimize potential problems in these areas. The maps should be most useful for identifying unstable and erosion-prone areas on a regional scale, and in the preparation of large scale, long-range management plans that use geologic information to minimize environmental impacts. The maps should not be used a substitute for on-the-ground site-specific studies, but rather for identification of possible problem areas that need on-the-ground attention prior to development. Thus, identification of a landslide or geomorphic feature on the map does not preclude logging or other types of land development at that particular site.
Availability
Watersheds maps may be referenced at all three CGS offices, and purchased in the Sacramento office. Maps are available for downloading in PDF format.
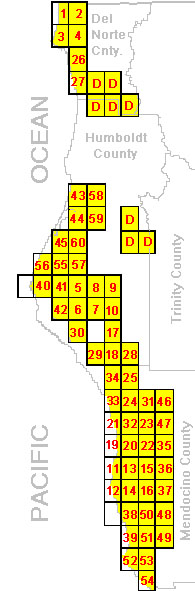
D = Quadrangle mapped by
California Department of
Water Resources
(names not listed) |
INDEX # |
NAME |
OFR # |
|---|
|
1 |
Smith River |
83-19 |
|
2 |
High Divide |
83-18 |
|
3 |
Crescent City |
82-21 |
|
4 |
Hiouchi |
83-04 |
|
5 |
Scotia |
82-20 |
|
6 |
Bull Creek |
83-03 |
|
7 |
Weott |
83-06 |
|
8 |
Redcrest |
83-17 |
|
9 |
Bridgeville |
83-23 |
|
10 |
Myers Flat |
83-22 |
|
11 |
Fort Bragg |
83-05 |
|
12 |
Mendocino |
83-15 |
|
13 |
Glenblair NW (Noyo Hill) |
82-25, 95-08 |
|
14 |
Glenblair SW (Mathison Peak) |
83-20 |
|
15 |
Glenblair NE (Northspur) |
82-19 |
|
16 |
Glenblair SE (Comptche) |
83-21 |
|
17 |
Miranda |
83-25 |
|
18 |
Garberville |
83-26 |
|
19 |
Inglenook |
83-31 |
|
20 |
Dutchman’s Knoll |
83-33 |
|
21 |
Westport |
83-32 |
|
22 |
Sherwood Peak |
83-38 |
|
23 |
Cahto Peak |
83-39 |
|
24 |
Leggett |
83-40 |
|
25 |
Noble Butte |
83-41 |
|
26 |
Childs Hill |
84-07 |
|
27 |
Requa |
84-08 |
|
28 |
Harris |
84-09 |
|
29 |
Briceland |
84-10 |
|
30 |
Honeydew |
84-11 |
|
31 |
Tan Oak Park |
84-17 |
|
32 |
Lincoln Ridge |
84-14 |
|
33 |
Hales Grove |
84-15 |
|
34 |
Piercy |
84-16 |
|
35 |
Longvale |
84-18 |
|
36 |
Willits NW (Burbeck) |
84-19 |
|
37 |
Willits SW (Greenough Ridge) |
84-20 |
|
38 |
Elk |
84-12 |
|
39 |
Mallo Pass Creek |
84-13 |
|
40 |
Capetown |
84-34 |
|
41 |
Taylor Peak |
84-36 |
|
42 |
Buckeye Mountain |
84-37 |
|
43 |
Arcata North |
84-38 |
|
44 |
Arcata South |
84-39 |
|
45 |
Fields Landing |
85-04 |
|
46 |
Iron Peak |
84-40 |
|
47 |
Laytonville |
84-41 |
|
48 |
Boonville NW (Bailey Ridge) |
84-42 |
|
49 |
Boonville SW (Philo) |
84-43 |
|
50 |
Navarro NE (Navarro) |
84-44 |
|
51 |
Navarro SE (Cold Springs) |
84-45 |
|
52 |
Point Arena |
84-46 |
|
53 |
Point Arena NE (Eureka Hill) |
84-47 |
|
54 |
Gualala |
84-48, 95-05 |
|
55 |
Fortuna |
85-01 |
|
56 |
Ferndale |
84-35 |
|
57 |
Hydesville |
85-02 |
|
58 |
Blue Lake |
85-06 |
|
59 |
Korbel |
85-05 |
|
60 |
McWhinney Creek |
85-03 |
|
61 |
Jackson State Forest |
95-08, 82-25, 83-15, 83-20 |
|
Latour Forest SHP (not on map) |
Not an OFR, but map may be ordered from any
CGS Publications Office. |
|
Soquel Forest (not on map) |
Not an OFR, but map may be ordered from any
CGS Publications Office. |
|
Mokelumne River (not on map) |
95-06 |
